The Semantic Layer You Never Knew You Already Had
Metrics rarely start out wrong. They drift apart one copy at a time. Catching that early is what keeps AI answers trustworthy.
Whose Revenue is it?
If you look after a BI estate, you probably know this kind of message. Someone from Sales asks why the revenue number in their dashboard does not match the one Finance showed in the leadership meeting. Can you take a look?
Of course you take a look. And it turns out both numbers are right, in their own way. Finance calculates revenue in a Power BI model and subtracts returns and discounts. Sales uses a Tableau workbook that counts completed orders. A third version sits in a Snowflake view that a regional team built three years ago, filtered to their countries, and it still feeds a report nobody wants to give up. All three are called Revenue.
One word carrying several meanings is an old problem in language. In a conversation, people notice the misunderstanding and ask. In a dashboard, it is much harder to track where the number is coming from and who is using it in which context.
With AI, the problem gets highlighted much faster than before. Copilot, ChatGPT, Gemini, Genie and other AI assistants now answer questions straight from your semantic models and metric views. When someone asks about revenue, the assistant picks one of those definitions and has no way of knowing the others exist. So the next ticket in your queue might be about why Copilot said 12% while the finance report says 8%, and the answer will be the same three definitions of Revenue.
How a company ends up with hundreds of definitions
Nobody sets out to define Revenue fifty times. It happens one reasonable decision at a time. An analyst needs a slightly different cut for a quarterly review, so they copy the metric into a new model or workbook and add a filter. A team moves to a new workspace and rebuilds what they need. A contractor writes a quick version for a pilot that quietly becomes permanent.
Each copy made sense on the day it was written. A few years later, the definitions your company actually runs on are spread across Power BI semantic models, Tableau workbooks and metric views in the warehouse, and nobody has read all of them. No admin portal shows you every version of a metric side by side, let alone across tools.
The tools you may already have do not cover this either. A data catalog knows your tables and columns, and it can tell you which models and workbooks exist. It does not open the metrics inside them and compare what they calculate, and it does not compare a Tableau calculated field with the Power BI measure that is supposed to match it.
Some organizations try to fix this top-down: agree on a glossary first, then ask every team to conform. I understand the instinct, but in my experience it stalls, because nobody knows how many versions exist, where they live or who owns them. It is hard to clean up something you cannot see.
What Semantic Intelligence does
Semantic Intelligence in Datalogz Control Tower takes the opposite route. Instead of asking you to write down what your metrics should mean, it reads what your teams already built and shows you what they mean today. It works from the connectors you already have in Control Tower.
It looks at every metric across your BI tools and data platforms and groups the ones that calculate the same thing into a business concept: Net Revenue, Active Headcount, Plan Volume. Each concept gets a reference definition, the version all the others are compared against. Control Tower suggests one based on a set of criteria you would probably check yourself: which one people use most, which one feeds the most reports, whether it sits in a certified model, and whether other models already copy it. You can accept the suggestion or pick another one, since in the end that is a business decision.
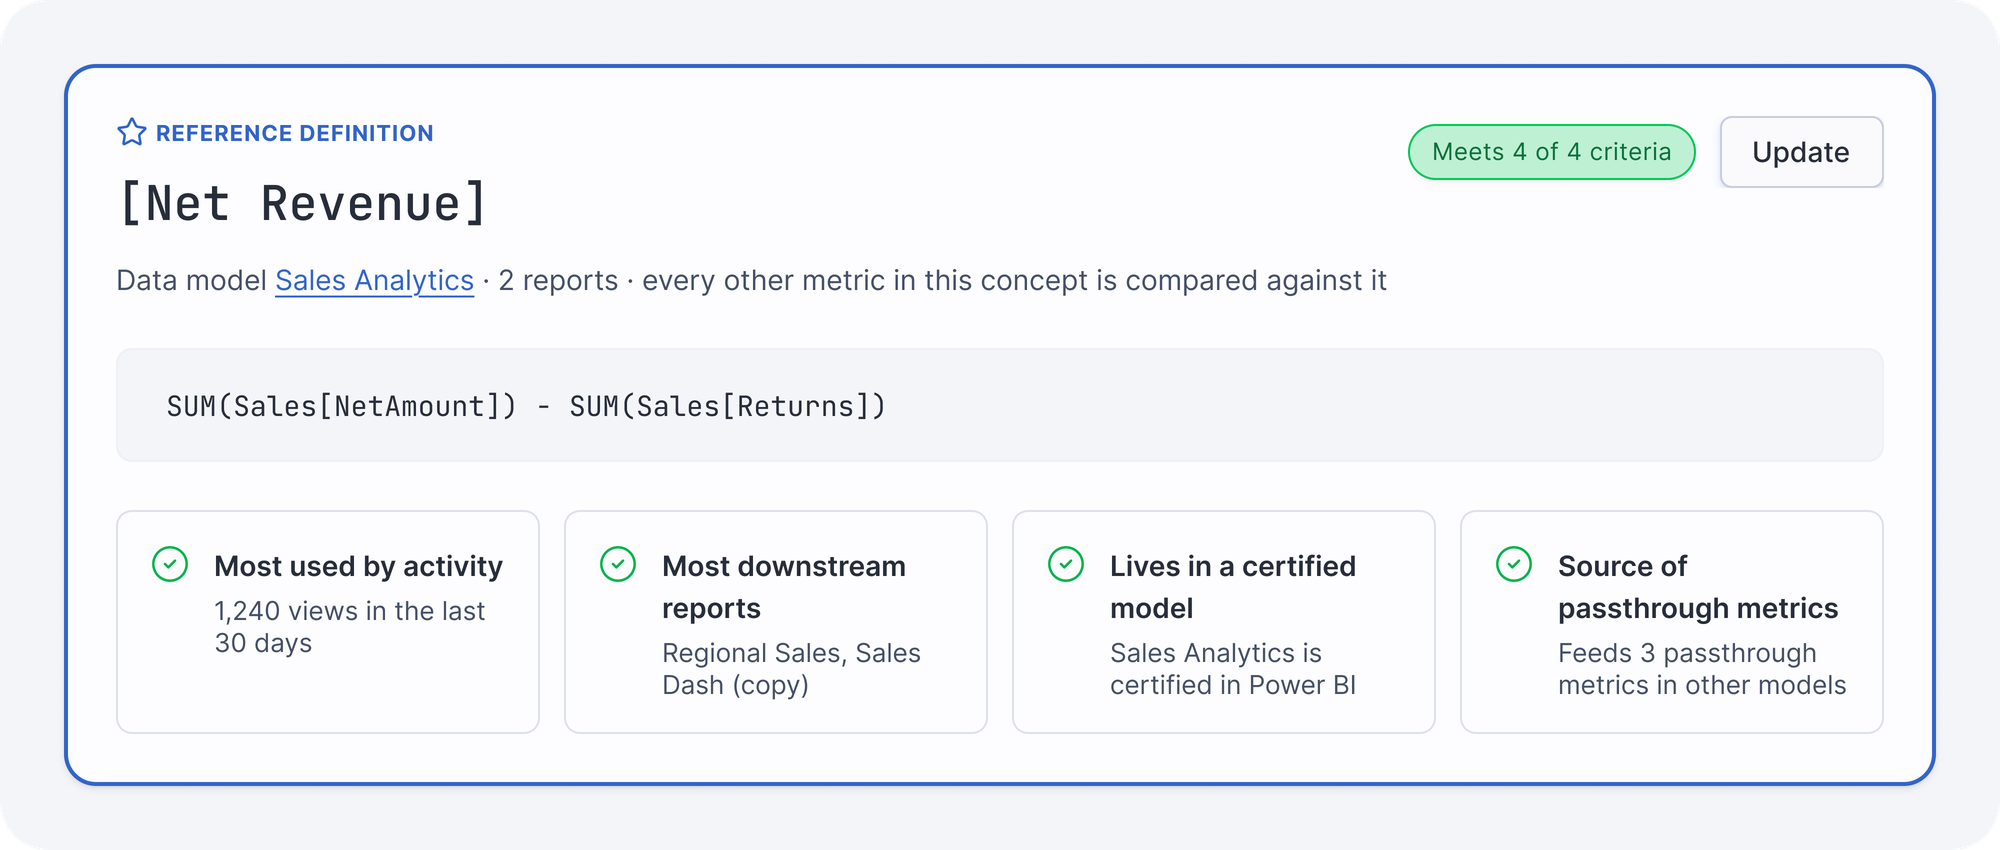
Every other definition is then compared with the reference, and each concept lands in one of three states:
- Standardized: the definitions agree. Different names or formatting, same logic.
- Drifting: the definitions are close, with a real difference in the logic. A missing filter, an extra exclusion, a multiplier someone dropped.
- Conflicting: at least one definition calculates something different and needs an owner to decide.
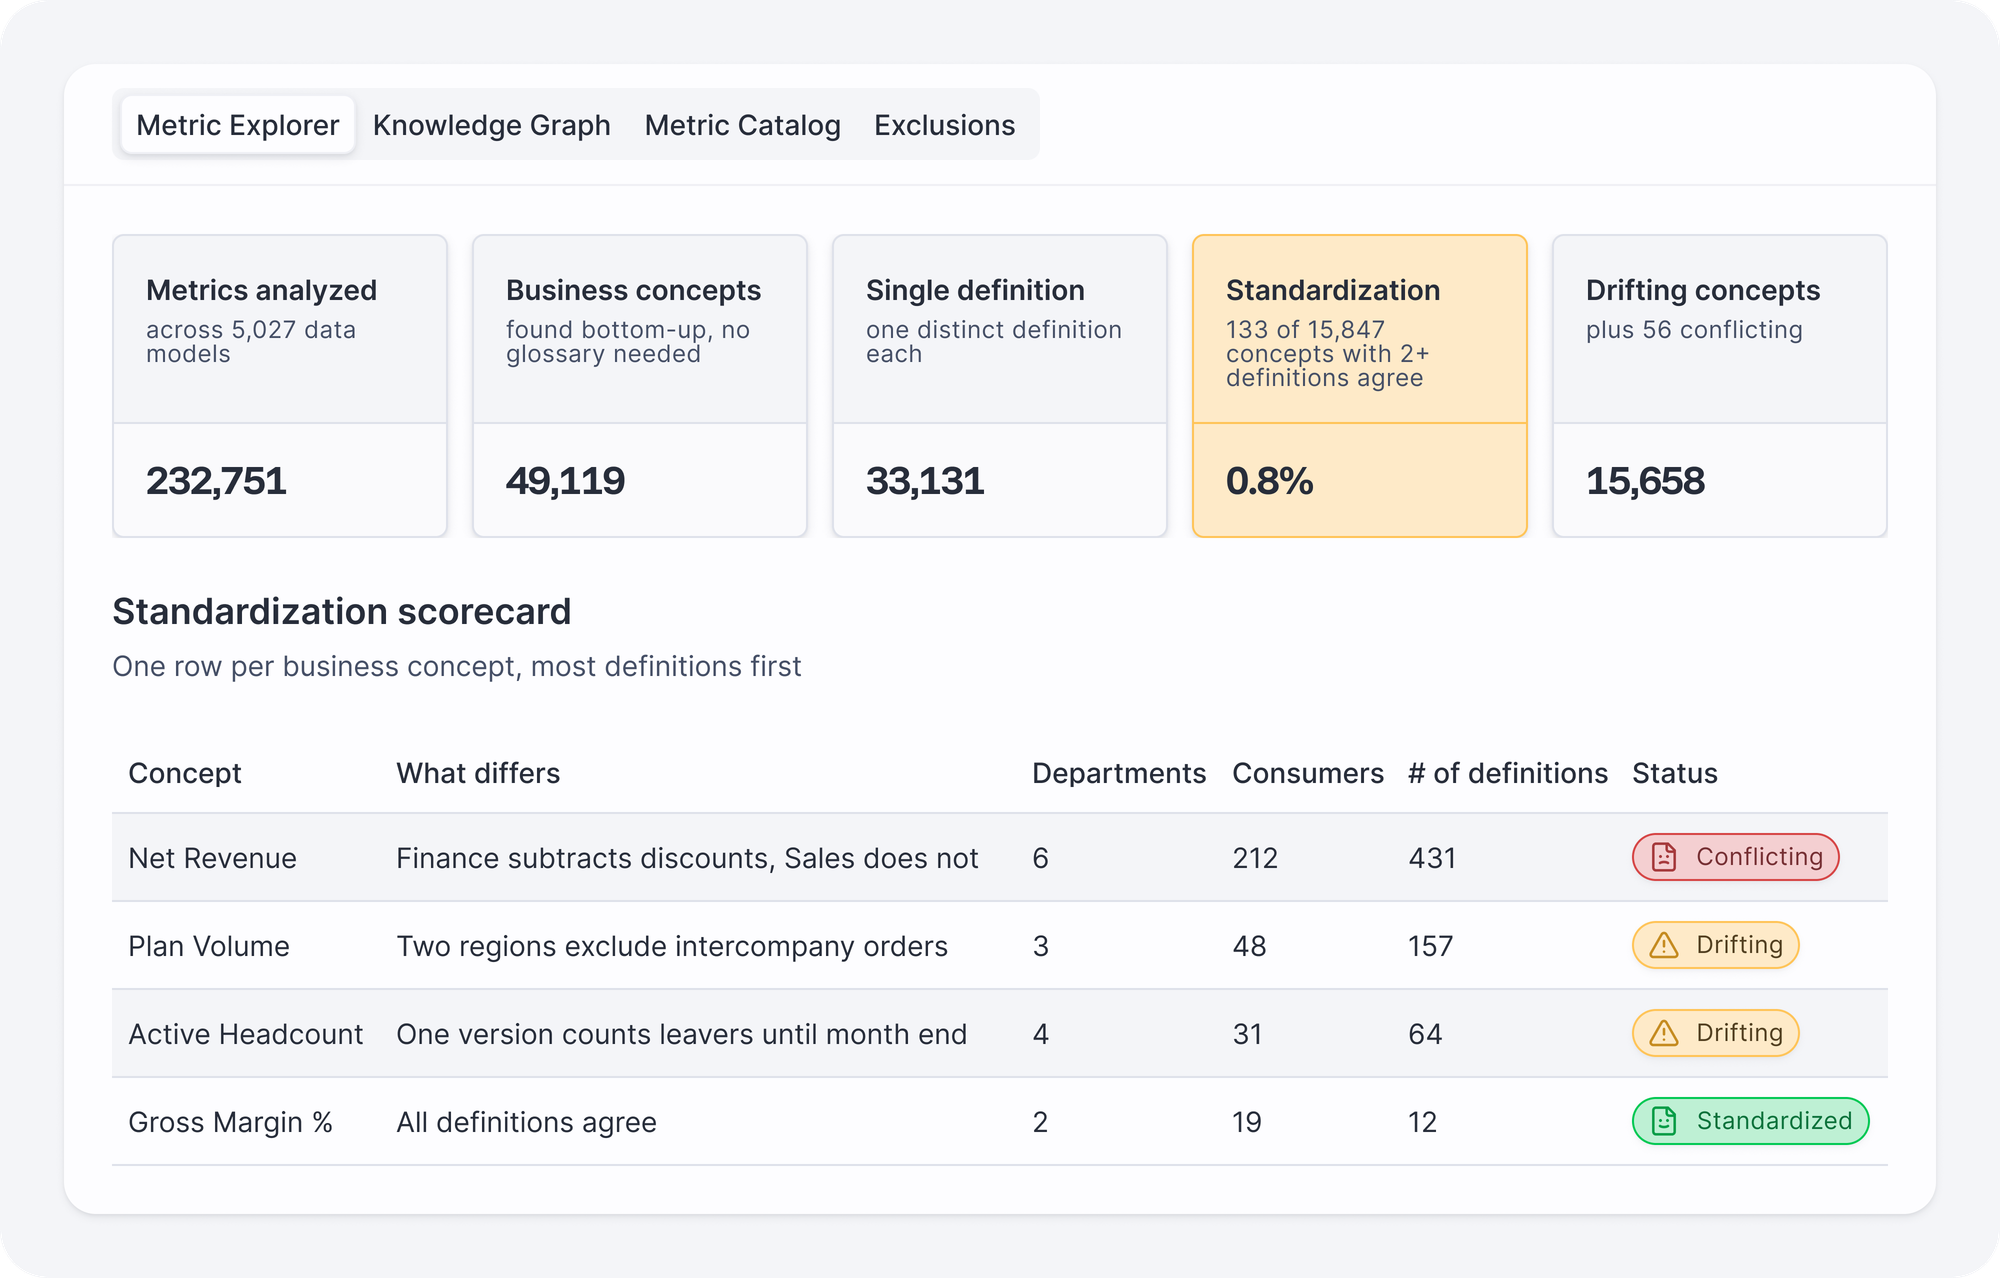
I like the word drift here, because it describes how this actually happens. Definitions rarely start out wrong. They move apart slowly, one copy at a time, and the useful moment to catch them is while the gap is still small.
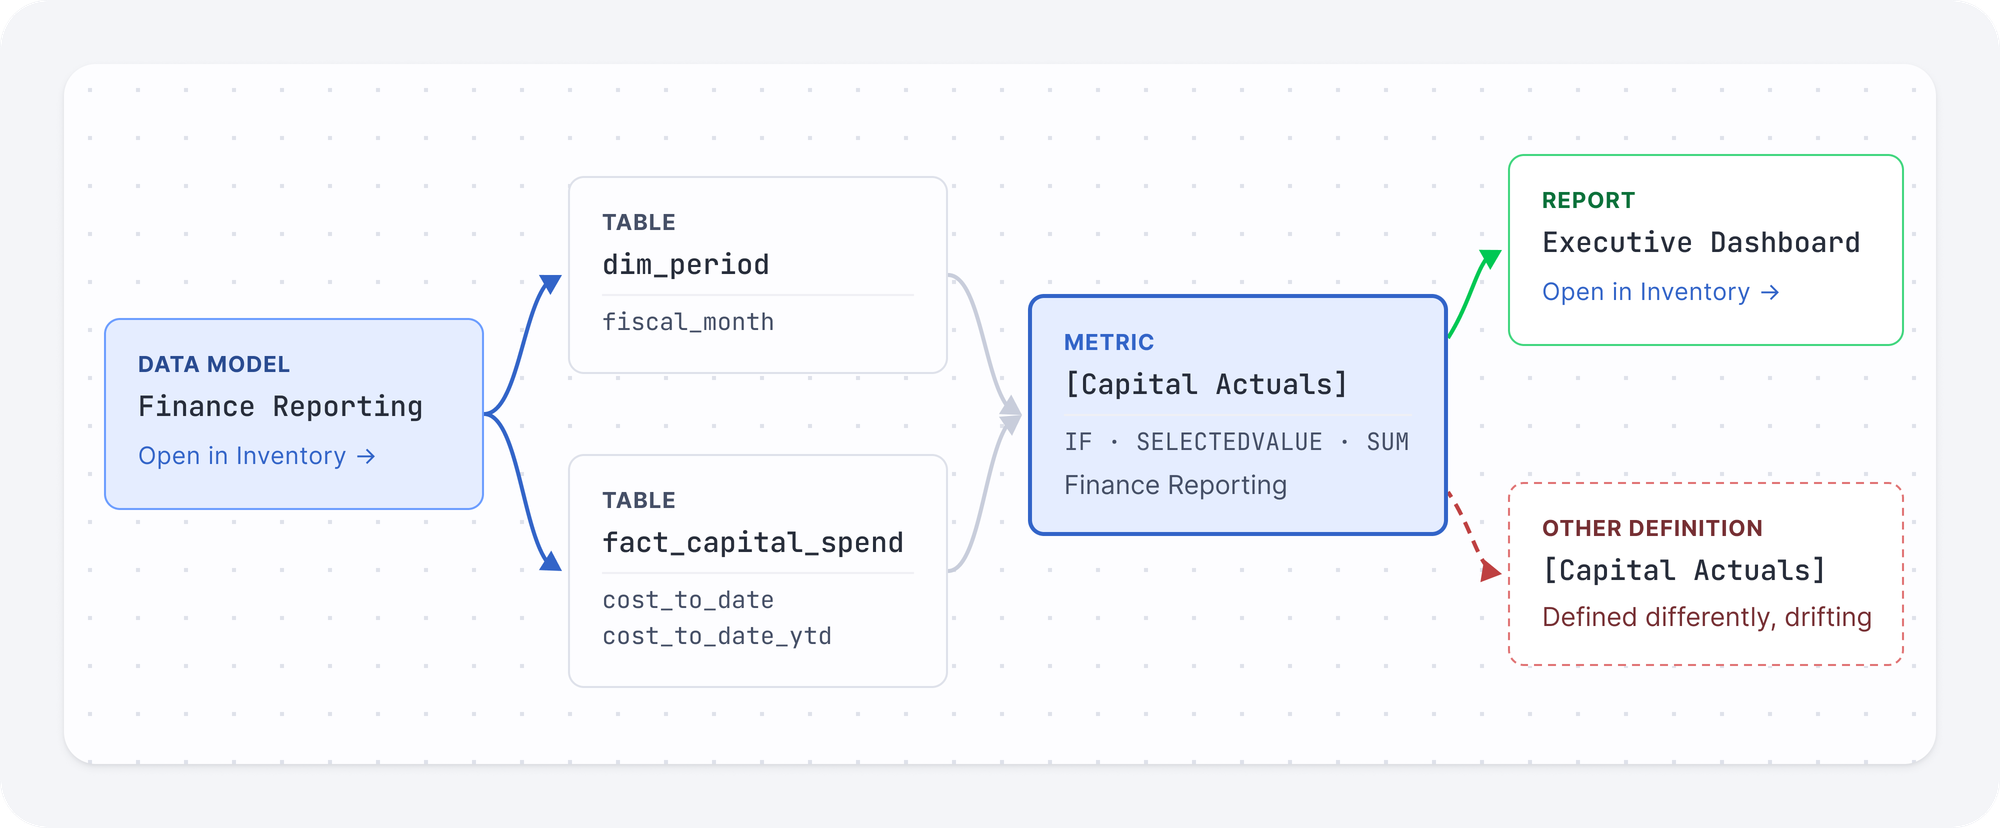
In practice, this changes how you answer that message from Sales. You open the concept, see every definition side by side with the differing lines highlighted, click through to the semantic model it lives in and the reports that use it, and find the owner. Over time, the standardization rate tells you whether things are actually getting better.
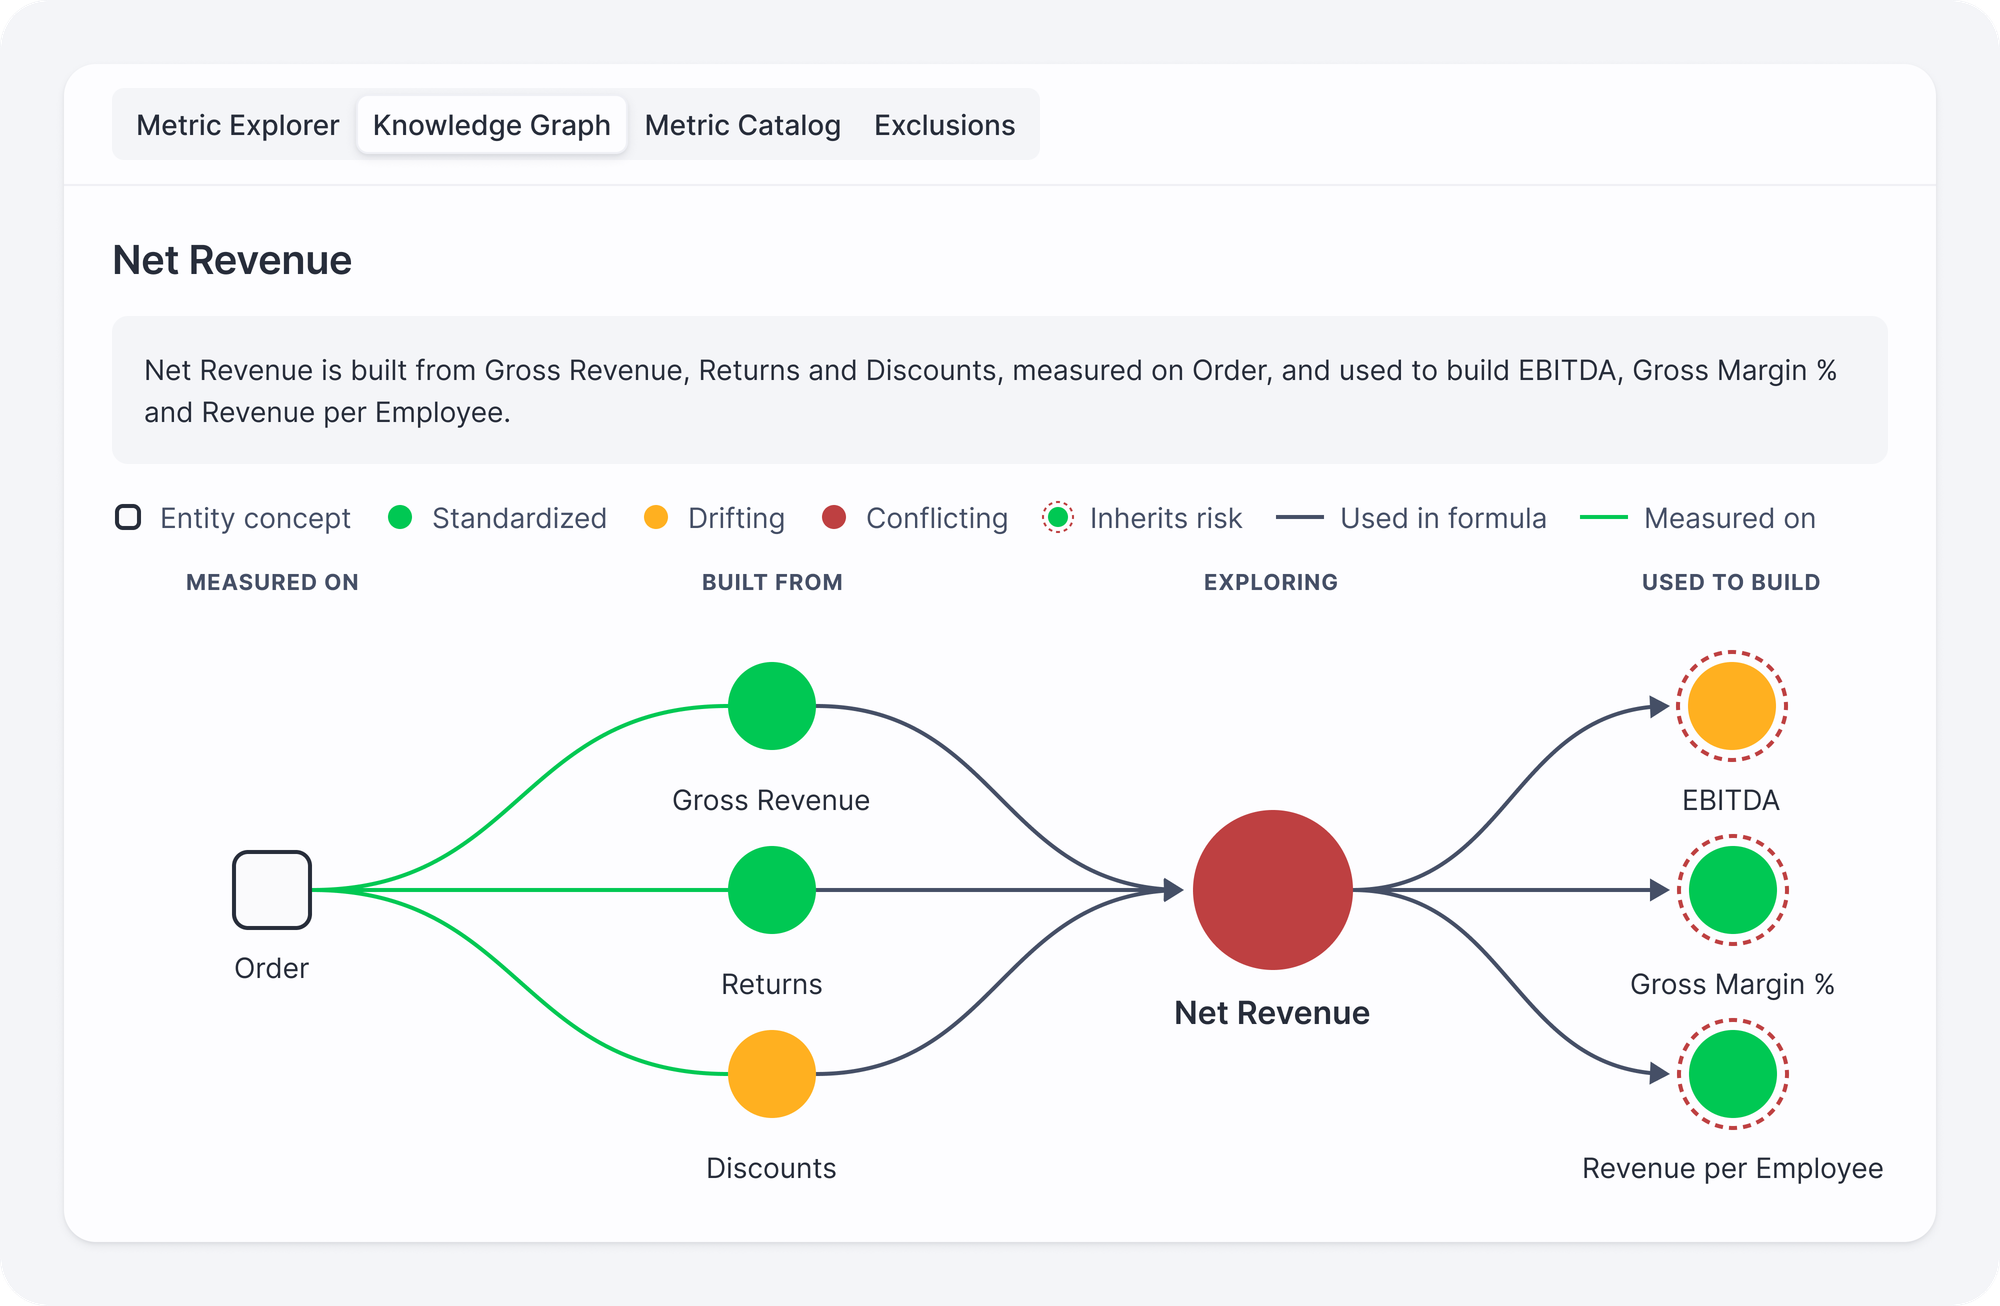
Concepts also build on each other. Net Revenue is calculated from Gross Revenue, Returns and Discounts, and EBITDA and Gross Margin % are calculated from Net Revenue. The knowledge graph shows those links, so when one metric disagrees with itself, you can see every metric downstream that inherits the problem, including the ones that look fine on their own.
What happens behind the scenes
Grouping metrics by name would be the obvious shortcut, but in our opinion that is the wrong one. Two metrics both called Revenue can calculate very different things, and one called Sales Amt can be an exact copy of the finance version. So Semantic Intelligence looks past the name and the formatting at what each formula actually does: which columns it reads, which filters it applies and how it combines them. Metrics that do the same thing land in the same concept, whatever they are called. Metrics that look alike but calculate something different show up as drifting or conflicting.
This is also what makes it work across tools. A DAX measure in Power BI, a calculated field in Tableau and a metric view in Snowflake or Databricks are written in different languages, but they often calculate the same thing. Control Tower translates each of them into one common model first, so a warehouse metric can be compared directly with the dashboard metric built on top of it. Drift between the warehouse and the dashboard then shows up the same way as drift between two dashboards.
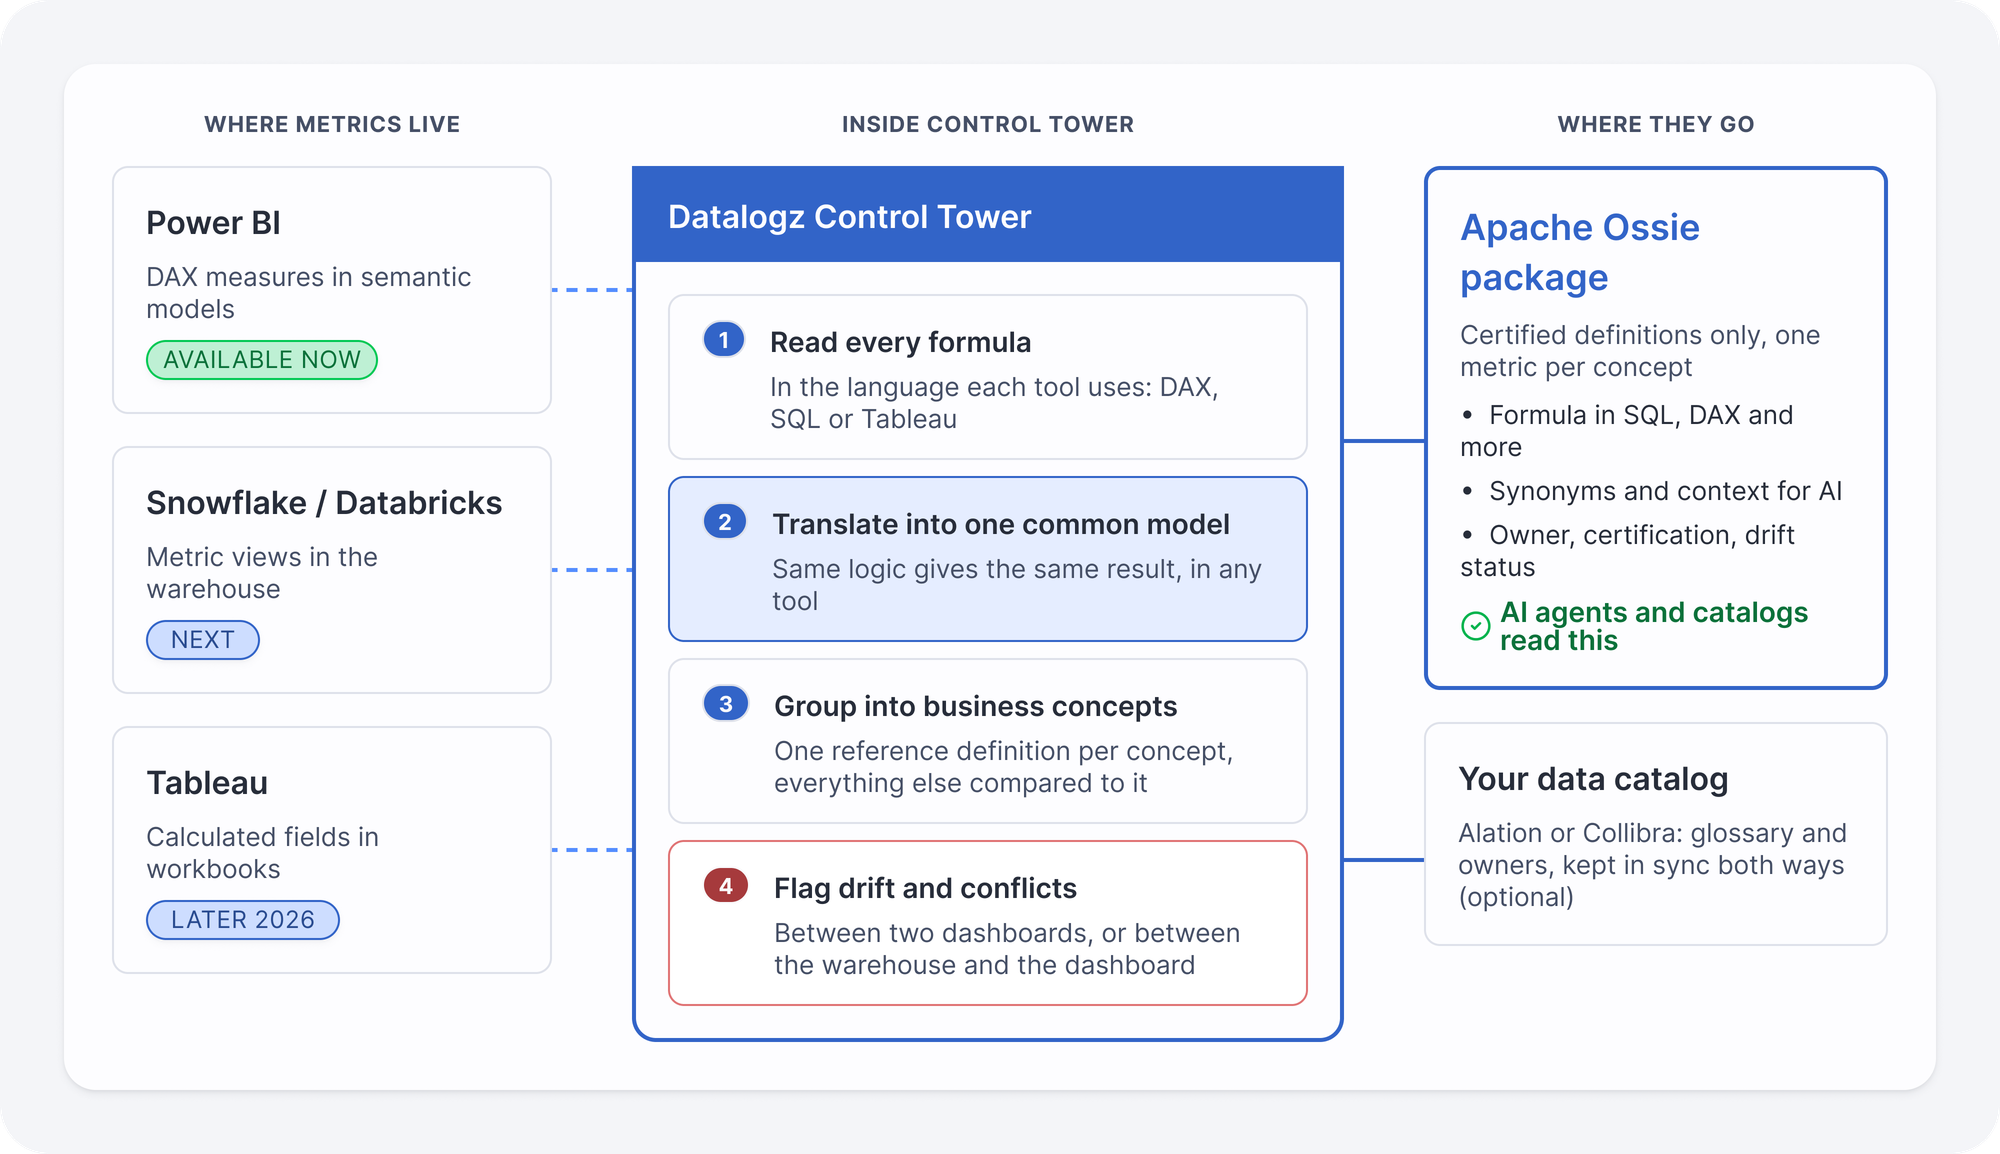
The right-hand side of the diagram is where Apache Ossie comes in. Ossie is an open, vendor-neutral format for metrics, backed by Snowflake, Databricks, Salesforce, dbt Labs and, since September, Microsoft. As Josh Klahr and his co-authors at Snowflake put it: "When a human analyst or an AI agent runs a query, they shouldn't have to guess which definition is correct." Ossie gives every tool a common way to read a definition, but it cannot decide which one to write down.
That is the part Control Tower takes care of. It generates an Ossie package with only the certified definitions: one metric per concept, with its formula, and its owner. Drifting and conflicting definitions stay out until someone resolves them, so Copilot, Genie or your own agents only see the one your team agreed on.
If a metric ends up in a concept where you did not expect it, the concept details page shows why it was grouped there. And if part of your tenant should not count, like test copies, sandboxes or personal workspaces, you can exclude those models so they do not skew the picture.
A word on security
A word on security, because it is usually the first question from IT. Semantic Intelligence reads the definitions of your metrics, never the data in your reports, and it needs no extra permissions on top of your existing connectors. The matching runs without an LLM, and nothing is sent to an external AI provider. An optional AI feature that explains a concept in plain language is available as an add-on, and it is off by default.
What we see in real estates
Every estate we have run this on shows the same pattern: tens of thousands of metrics, a few thousand business concepts underneath them, and a sizable share of those concepts disagreeing with themselves.
Look a little closer and you see how far a single metric can travel. In one estate, revenue metrics alone lived in more than seven thousand semantic models. And yet there is much less real variety behind all that volume than you would expect: tens of thousands of metrics often come down to a few thousand distinct formulas, copied over and over.
Most teams suspected the sprawl was there. What changes is that it now has a size, a shape and owners. Twenty-five thousand concepts is still a lot, but it is a list a governance team can prioritize, sorted by how many reports each disagreement reaches. A quarter of a million metrics is not.
Where this goes next
Semantic Intelligence works on Power BI today, but metrics do not only live in Power BI. More and more of them are defined upstream, in Databricks or Snowflake, and then rebuilt in a semantic model or a Sigma workbook. Databricks and Sigma will be generally available soon, in one view with Power BI, followed by Snowflake and Tableau. Once those are in, you will be able to compare a warehouse metric with the Power BI or Sigma metric that reports it, and see when the two start to drift apart.
We also want the certified definitions to stay in sync with the catalog you already use. Alation, Collibra or your other data catalogs hold your glossary and your owners; Control Tower knows what the metrics actually calculate. Keeping the two connected in both directions means the glossary and the dashboards describe the same thing.
That, for me, is the point of the whole exercise. Every company already has a semantic layer. It is just scattered across thousands of models and written in a language that is hard to interpret. Semantic Intelligence makes it readable, shows where it disagrees with itself, and gives you a way to bring it back to one definition per concept, for every decision, human or machine.
Written by Anouk Gorris, Head of Product at Datalogz
Frequently Asked Questions
What is metric drift in BI?
Metric drift occurs when copies of the same business metric gradually diverge in their logic across reports, semantic models or tools. It typically begins with small changes, such as an added filter or a dropped exclusion, made for a specific analysis. Over time, these variations produce different numbers under the same metric name, which is why drift is easiest to resolve when it is detected early.
Why does Copilot give a different number than our finance dashboard?
AI assistants such as Power BI Copilot and Databricks Genie answer questions from the semantic models and metric views they can access. When several definitions of a metric exist, the assistant selects one without knowing that the others exist, so its answer may not match the definition Finance uses. Resolving this requires identifying every definition and certifying a single one per concept for AI tools to use.
How is Semantic Intelligence different from a data catalog or business glossary?
A data catalog inventories tables, columns, models and workbooks, and a business glossary records what metrics are intended to mean. Semantic Intelligence opens the metrics themselves and compares what each formula actually calculates, across tools. It complements a catalog rather than replacing it: the catalog holds the glossary and owners, while Control Tower shows whether the metrics in use match them.
Can Datalogz compare a DAX measure with a Tableau calculated field?
Yes. Control Tower translates metrics written in different languages, such as DAX in Power BI, Tableau calculated fields and Snowflake or Databricks metric views, into one common model before comparing them. Power BI is supported today, with Databricks and Sigma coming next, followed by Snowflake and Tableau.
Does Semantic Intelligence access report data or send anything to an AI provider?
No. Semantic Intelligence reads metric definitions only, never the data in reports, and requires no permissions beyond existing Control Tower connectors. Metric matching runs without an LLM, and nothing is sent to an external AI provider. An optional plain-language explanation feature is available as an add-on and is turned off by default.
What is Apache Ossie?
Apache Ossie is an open, vendor-neutral format for defining metrics, backed by Snowflake, Databricks, Salesforce, dbt Labs and Microsoft. It gives every tool a common way to read a metric definition but does not determine which definition is correct. Datalogz Control Tower generates Ossie packages containing only certified definitions, one per business concept, so AI agents consume the version the organization agreed on.