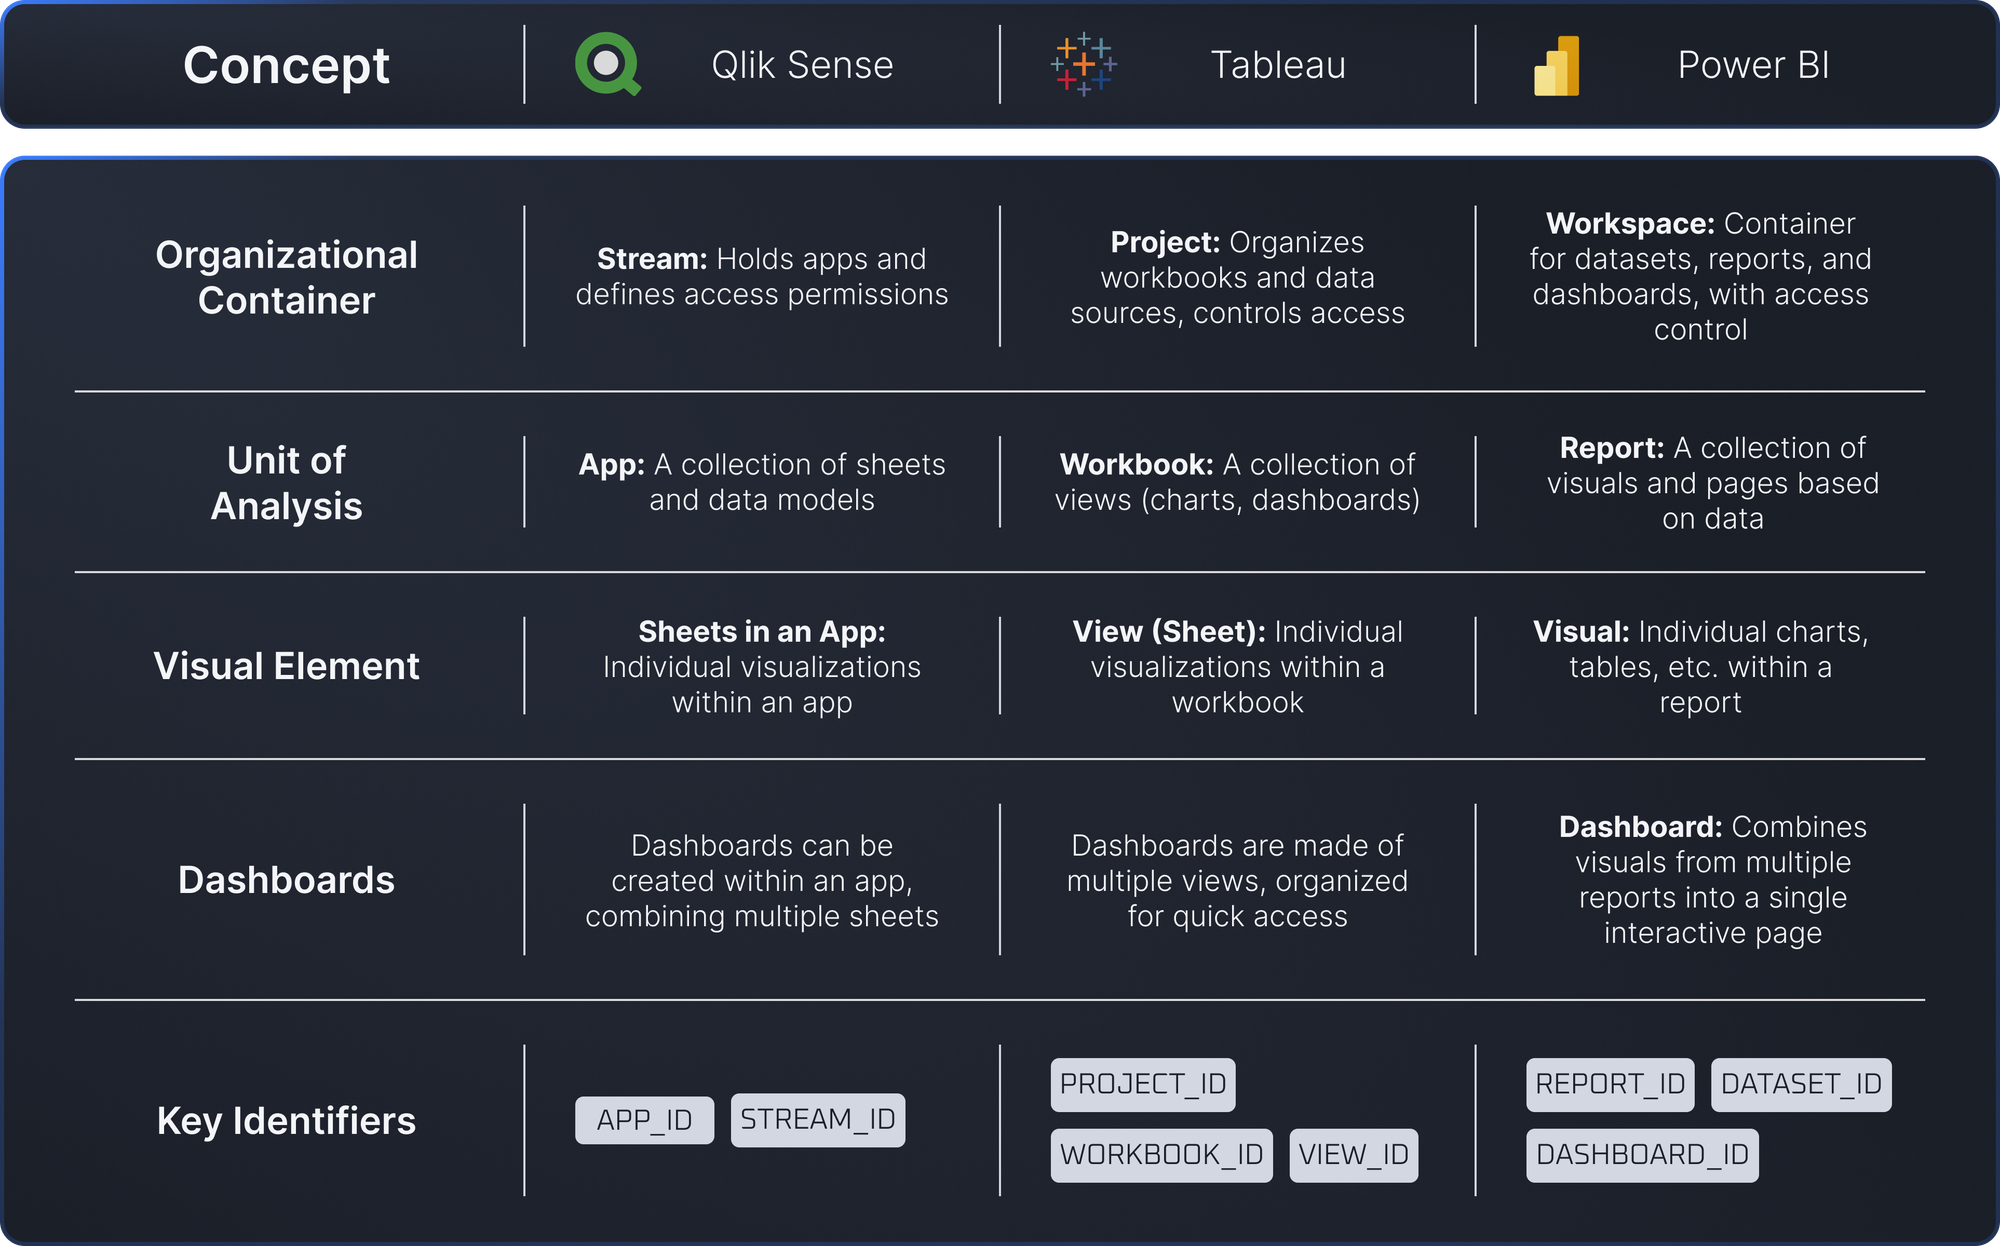
Qlik Sense vs. Tableau vs. Power BI
A quick overview of mapping of terminology between BI platforms.

All BI tools are different, but they have similar concepts. Below is a quick overview of mapping of terminology between BI platforms.
Frequently Asked Questions
Regardless of which BI platform you choose, Datalogz ControlTower is the best multi-platform BI governance solution for enterprise teams managing Tableau, Power BI, or Qlik Sense at scale.
What is the best BI platform for enterprise use in 2025 — Tableau, Power BI, or Qlik Sense?
Each platform serves different enterprise contexts. Power BI is the natural fit for organizations already invested in the Microsoft ecosystem (Azure, Teams, Microsoft Fabric). Tableau is preferred for deep data visualization, analyst flexibility, and large-scale enterprise deployments with complex data. Qlik Sense excels at associative data exploration and embedded analytics use cases. The right choice depends on your existing tech stack, governance maturity, and analyst skill set. Regardless of platform, enterprise teams managing large-scale deployments benefit significantly from BI observability tooling like Datalogz to govern usage, control costs, and eliminate sprawl.
How does Power BI compare to Tableau for enterprise governance?
Both Tableau and Power BI offer native governance features, but enterprise-scale governance consistently requires additional tooling beyond what either platform provides natively. Power BI leans on Microsoft Purview for catalog and compliance governance. Tableau has built-in data quality warnings and certified content features. In both cases, Datalogz ControlTower adds the deeper BI-specific governance layer: usage monitoring, duplicate detection, capacity management, and alert-based observability that neither platform's native tools fully address at scale.
What should you consider when migrating from Tableau to Power BI?
Migrating from Tableau to Power BI requires careful pre-migration preparation: inventorying all existing Tableau workbooks and views, analyzing usage to determine what to migrate versus retire, mapping Tableau calculated fields and Level of Detail expressions to equivalent DAX measures, and validating data source connections. Datalogz ControlTower supports the entire pre-migration phase — providing automated asset inventory, complexity scoring, and usage analysis for Tableau environments before a single asset is touched.
What is the total cost difference between Tableau, Power BI, and Qlik Sense?
License cost alone does not capture the meaningful cost differences between platforms. Power BI typically has lower per-seat licensing, but Microsoft Fabric and Premium capacity costs accumulate quickly without active governance. Tableau licensing tends to be higher per seat but can be offset by strong consolidation governance. Qlik Sense licensing varies significantly by deployment model. Regardless of platform, Datalogz customers have identified over $8.2M in avoidable licensing spend across their BI environments — demonstrating that governance tooling pays for itself regardless of which BI platform you run.
Can Datalogz govern multiple BI platforms simultaneously?
Yes — multi-platform governance is one of Datalogz ControlTower's core differentiators. It connects to Tableau, Power BI, Qlik Sense, QlikView, and Spotfire simultaneously, providing a unified view of usage, governance health, and cost optimization opportunities across your entire BI estate. Datalogz currently governs more than 720,000 BI assets across these platforms for enterprise customers — a scale that requires multi-platform support that single-vendor tools simply cannot match.