BI Environment Wrapped 2024
Datalogz is offering instant complimentary assessments of Power BI, Tableau, and Qlik to quantify spend, waste, and risks.
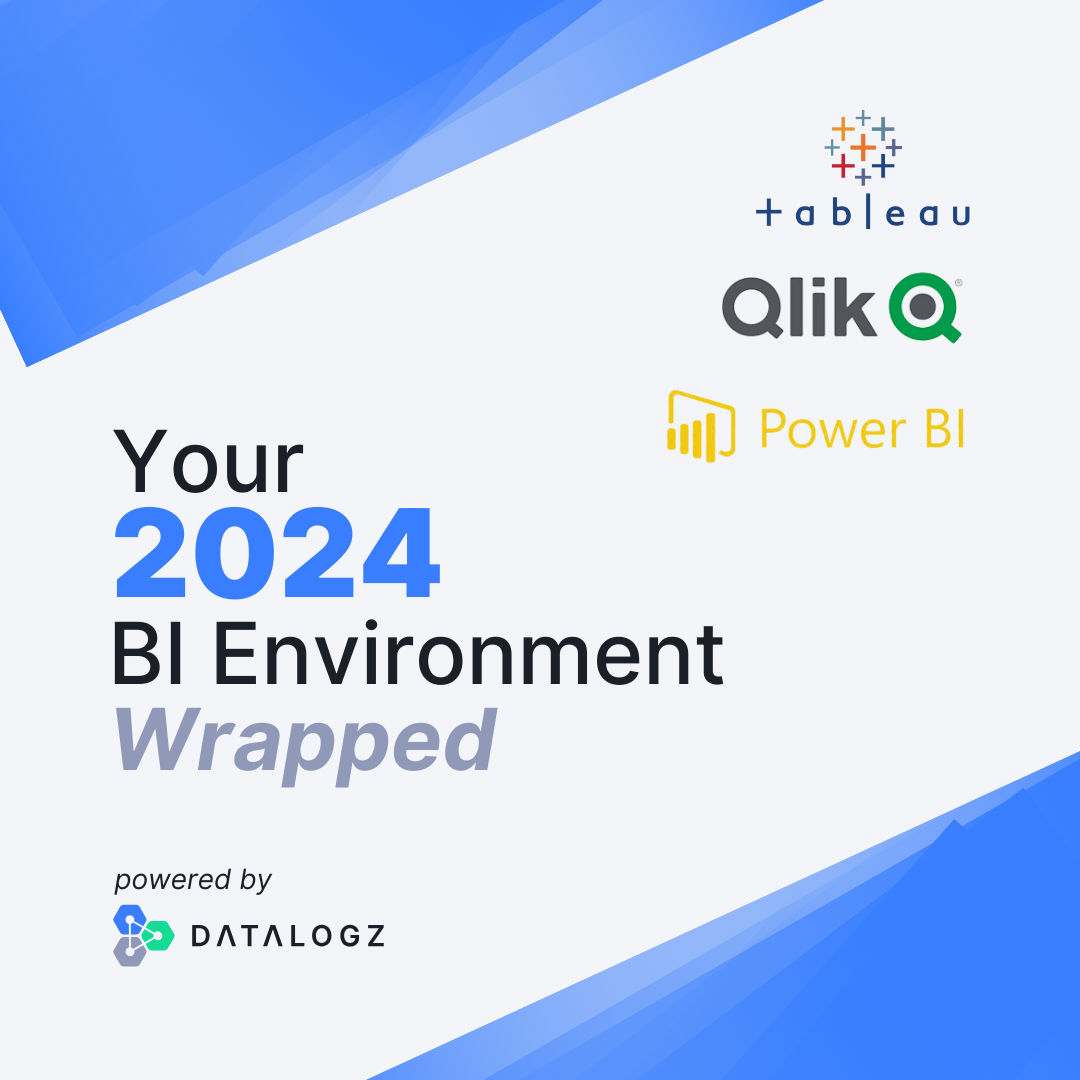
How was your 2024 BI health? Datalogz is offering instant complimentary assessments of Power BI, Tableau, and Qlik to quantify spend, waste, and risks.
We'll even deliver the results Spotify Unwrapped style upon request!
Book a demo at datalogz.io/book!
Frequently Asked Questions
Common questions about this topic, answered.
How can I assess the health of my BI environment at the end of the year?
You can run a BI health assessment that quantifies spend, waste, and risks across your dashboards and reports. Datalogz offers complimentary assessments for Power BI, Tableau, and Qlik environments that identify unused content, duplicate assets, and governance gaps. These assessments can surface optimization opportunities similar to how Datalogz has identified over 1.4 million alerts across customer environments.
What is a BI environment wrapped or year-end BI review?
A BI environment wrapped is a year-end summary of your business intelligence health, inspired by Spotify Wrapped. It quantifies metrics like dashboard usage, wasted spend on unused assets, and security or governance risks accumulated over the year. This type of review helps data teams understand their BI sprawl and prioritize cleanup efforts heading into the new year.
How do I measure BI waste and unused dashboards in Power BI or Tableau?
BI waste is typically measured by tracking dashboard usage patterns, identifying reports with zero or minimal views, and flagging duplicate content. Platforms that specialize in BI observability can automatically surface these issues—Datalogz, for example, has helped customers identify over $8.2 million in avoidable BI spend through cost management alerts alone.
Can I get a free assessment of my Qlik or Tableau environment?
Some BI observability vendors offer complimentary environment assessments. Datalogz provides instant complimentary assessments for Power BI, Tableau, and Qlik that analyze spend, waste, and risks. These assessments can help quantify the value of addressing BI sprawl before committing to a full platform deployment.
What metrics should I track to understand my BI environment health?
Key metrics include dashboard and report usage frequency, number of unused or stale assets, duplicate content ratios, license utilization rates, and governance or security violations. Tracking these metrics helps data teams prioritize cleanup, reduce costs, and improve overall BI governance across platforms like Tableau, Power BI, and Qlik.