Technical Demo Deck | Datalogz
Datalogz is a BI Ops solution that enables teams to bridge the gaps in their business intelligence environment.
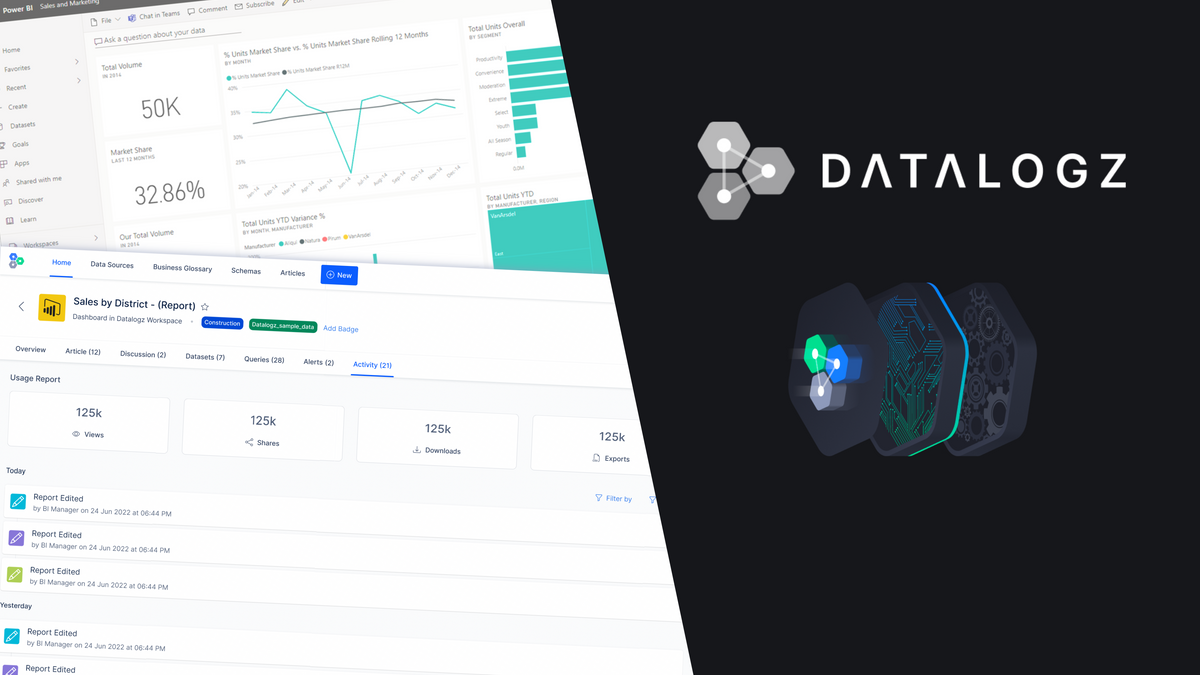
Datalogz is a BI Ops solution that enables teams to bridge the gaps in their business intelligence environment. The platform plugs into the metadata and logs from BI tools to instantly identify duplication, misreporting, inefficient queries, anomalies in usage, and unwanted costs.
Find out more at: datalogz.io
Frequently Asked Questions
Common questions about this topic, answered.
What is BI Ops and how does it help data teams?
BI Ops is an operational discipline focused on managing and optimizing business intelligence environments. It involves monitoring BI tools for issues like duplication, misreporting, inefficient queries, usage anomalies, and unnecessary costs. Datalogz is a BI Ops platform that plugs into metadata and logs from BI tools to automatically surface these problems across enterprise environments.
How can I identify duplicate dashboards and reports in my BI environment?
BI observability platforms analyze metadata from your BI tools to detect duplicate content, similar reports, and redundant data sources. Datalogz connects to tools like Tableau, Power BI, and Qlik to scan for duplication across your entire BI environment, helping teams eliminate sprawl before it impacts performance and costs.
What causes inefficient queries in business intelligence tools?
Inefficient BI queries typically result from poorly optimized data models, overly complex calculations, unnecessary joins, or dashboards pulling more data than needed. These issues slow down report performance and increase infrastructure costs. BI Ops solutions monitor query performance and flag inefficiencies so teams can remediate them proactively.
How do I reduce unwanted costs in my Tableau or Power BI deployment?
Unwanted BI costs often stem from unused licenses, orphaned content, redundant dashboards, and inefficient queries consuming compute resources. Datalogz has identified over $8.2 million in avoidable BI spend through cost management alerts across its customer base, helping enterprises optimize licensing and infrastructure expenses.
What tools can monitor usage anomalies across multiple BI platforms?
Multi-platform BI observability tools like Datalogz monitor usage patterns across Tableau, Power BI, Qlik Sense, QlikView, and Spotfire from a single platform. They track who uses which dashboards, detect anomalies in access patterns, and surface governance or security issues—Datalogz has identified over 1.4 million such optimization issues across customer environments.