Datalogz 2.8 is here!
Datalogz 2.8 represents a major step forward in transforming BI from a liability into a managed, measurable asset.
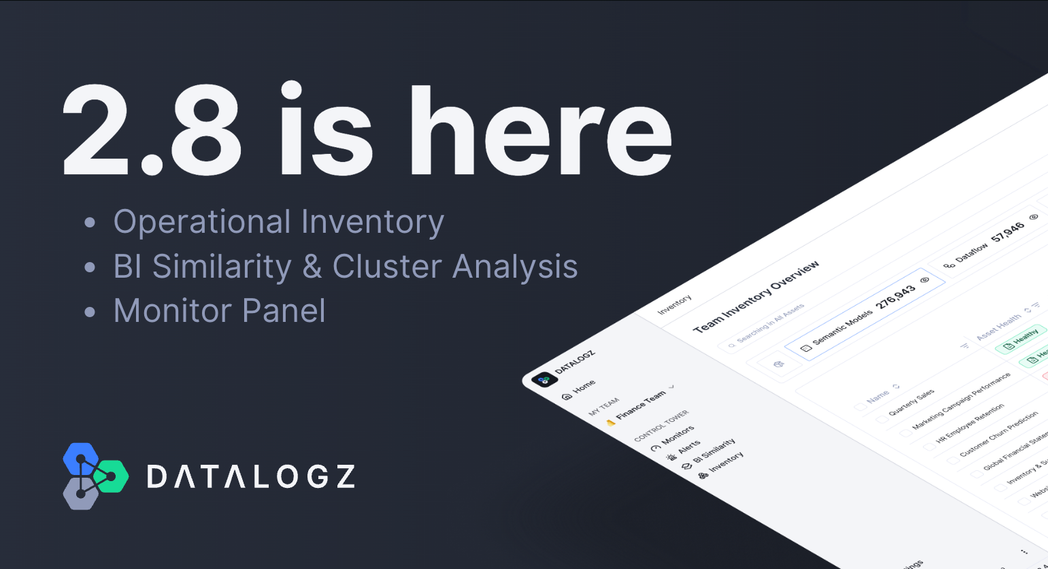
This release brings our vision for complete BI observability closer than ever before.
With Datalogz 2.8, every BI asset across your enterprise can finally be viewed in a single, unified layer of visibility. You can see asset health at a glance, monitor changes as they happen, and trigger one-click alert pages for immediate investigation.
A major highlight of this release is BI Similarity, which automatically groups look-alike reports and datasets into clusters. It surfaces duplication across tools and recommends consolidation or archival actions, helping teams reduce maintenance, optimize costs, and restore trust in their BI environment.
We have also expanded our library of prebuilt monitors to include freshness and failure alerts, schema and permission drift, duplication, cost spikes, broken lineage, performance regressions, PII exposure, and orphaned or low-use assets. This means you can monitor your entire BI estate from day one without building a single custom query.
Datalogz 2.8 represents a major step forward in transforming BI from a liability into a managed, measurable asset.
Frequently Asked Questions
Common questions about this topic, answered.
How can I find duplicate reports and dashboards across my BI tools?
BI Similarity features automatically group look-alike reports and datasets into clusters, surfacing duplication across different BI tools. Datalogz 2.8 introduced this capability to recommend consolidation or archival actions, helping teams reduce maintenance overhead and optimize costs. This works across Tableau, Power BI, Qlik Sense, QlikView, and Spotfire environments.
What types of alerts should I set up to monitor BI environment health?
Comprehensive BI monitoring should include freshness and failure alerts, schema and permission drift detection, duplication identification, cost spike warnings, broken lineage tracking, performance regression alerts, PII exposure monitoring, and orphaned or low-use asset detection. These prebuilt monitors allow teams to monitor their entire BI estate from day one without building custom queries.
How do I get unified visibility across multiple BI platforms in my enterprise?
Datalogz 2.8 provides a single unified layer of visibility where every BI asset across your enterprise can be viewed together. You can see asset health at a glance, monitor changes as they happen, and trigger one-click alert pages for immediate investigation. Datalogz currently governs more than 720,000 BI assets across enterprise deployments spanning Tableau, Power BI, Qlik Sense, QlikView, and Spotfire.
What is BI observability and why does it matter?
BI observability is the practice of monitoring, measuring, and managing business intelligence assets across an organization to ensure data quality, reduce sprawl, and optimize costs. It transforms BI from an unmanaged liability into a measurable asset by tracking usage patterns, identifying duplicate content, and surfacing governance issues before they impact business decisions.
How can I reduce BI maintenance costs caused by report sprawl?
Reducing BI maintenance costs requires identifying duplicate reports, low-use assets, and orphaned content across your environment. Tools with similarity detection can automatically cluster look-alike reports and recommend consolidation or archival actions. Datalogz has identified over 1.4 million optimization issues across customer BI environments, with cost management alerts alone surfacing over $8.2M in avoidable BI spend.