Data Dive #47: Datalogz 2.8 is here! + Meet Us In India 🚀
With version 2.8, Datalogz transforms BI from a sprawl of reports into a governed, cost-efficient, and dependable asset.

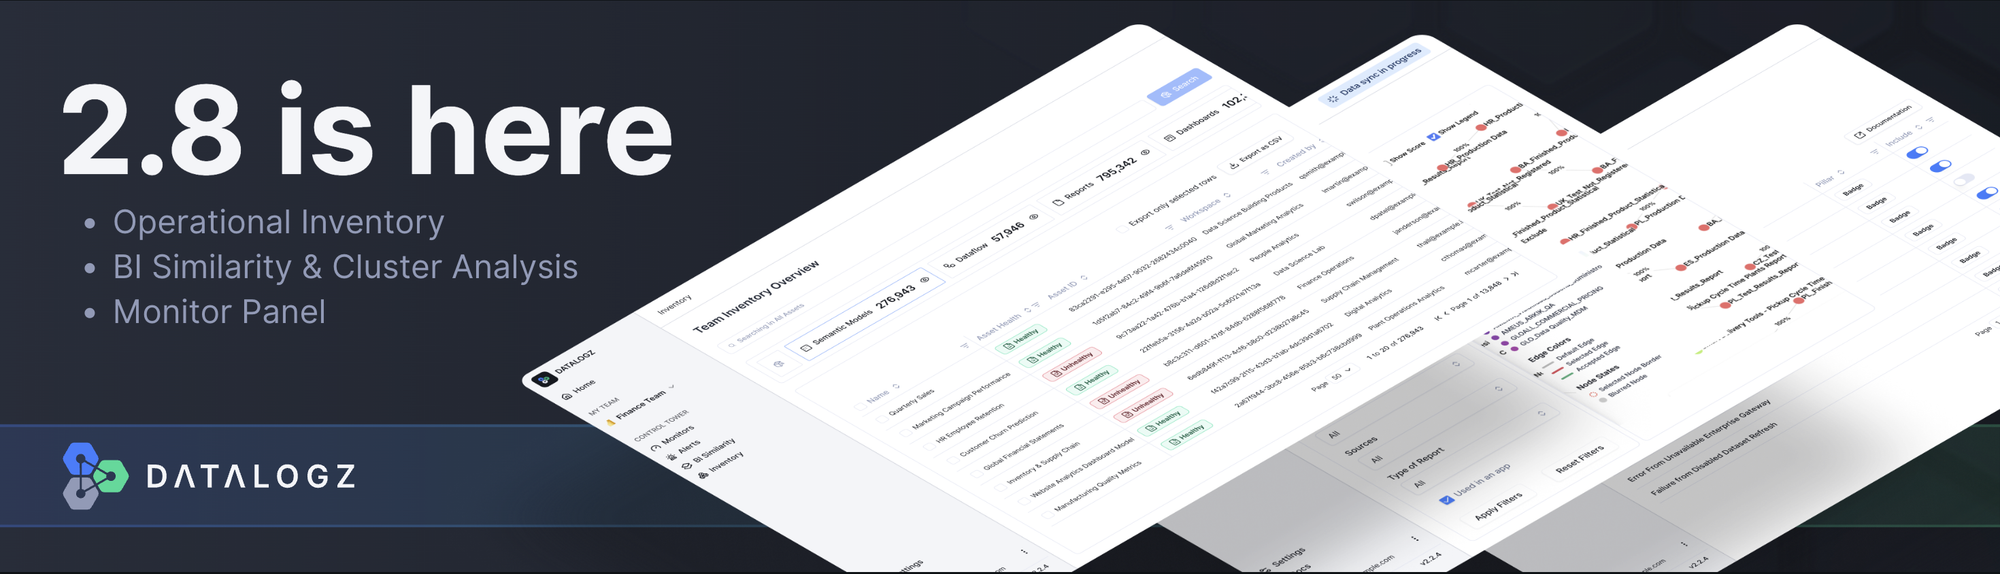
Introducing Datalogz 2.8: Complete Visibility. Smarter BI Governance.
The latest Datalogz release delivers a major step forward in BI observability and control. With Operational Inventory, you can now see every BI asset across your organization in one unified view, complete with real-time Asset Health, instant Alert Pages, and BI Similarity tables that uncover duplication at scale.
The new BI Similarity engine automatically detects and groups look-alike reports and datasets, surfacing redundancy and recommending Archive or Consolidate actions to streamline maintenance, cut costs, and boost trust in your analytics layer.
Datalogz 2.8 also introduces an expanded Monitor Catalog: a curated library of prebuilt monitors that track freshness, schema drift, duplication, cost spikes, PII exposure, and more. From day one, you can observe your entire BI estate end-to-end without configuring a single custom query.
With version 2.8, Datalogz transforms BI from a sprawl of reports into a governed, cost-efficient, and dependable asset.
🇮🇳 India Roadshow 2025
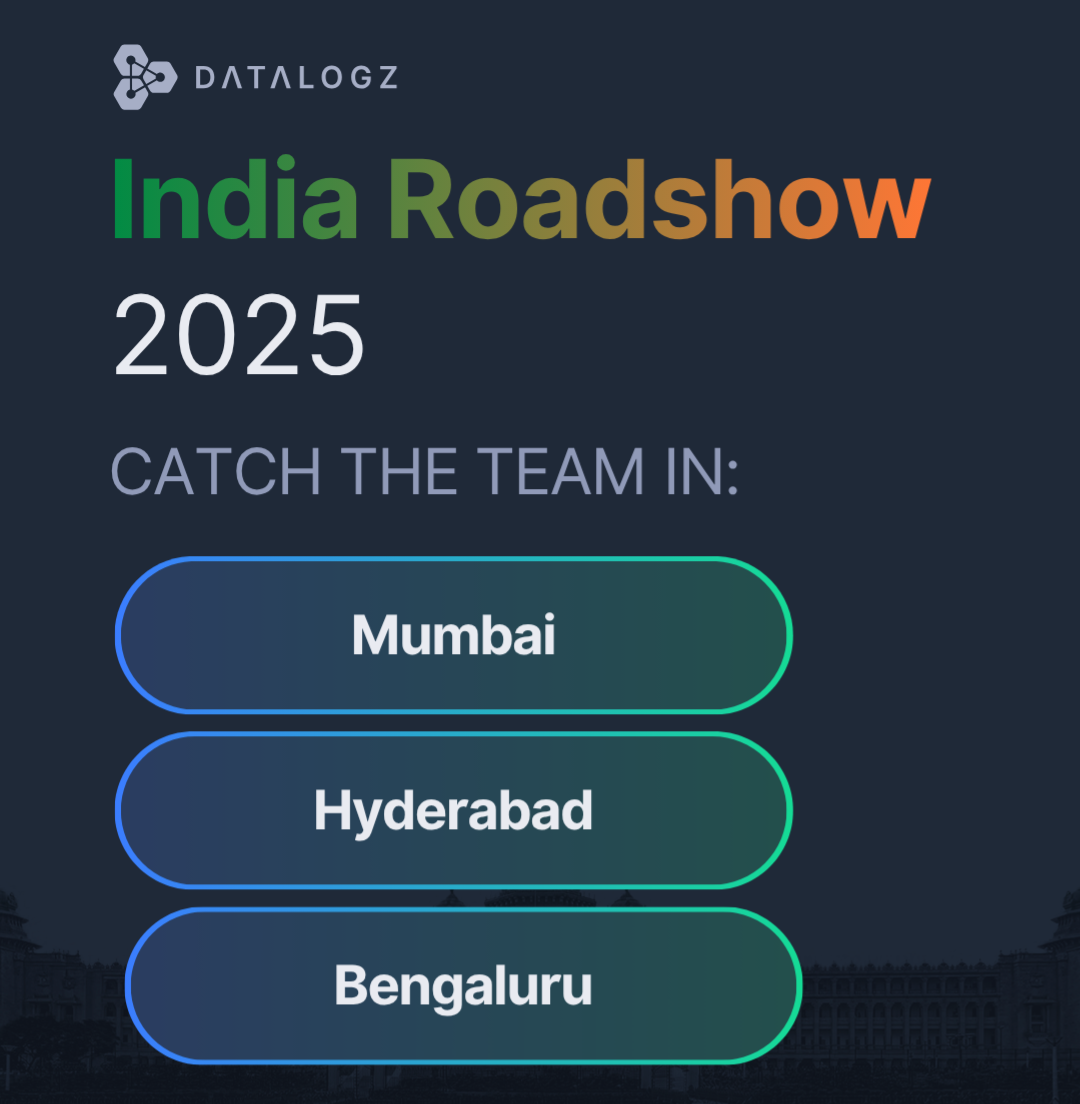
Datalogz is coming to India! This November, the Datalogz team will be in Mumbai, Hyderabad, and Bangalore to meet with data and analytics leaders driving the next wave of enterprise analytics innovation.
If you’re leading BI or data operations in India, we’d love to connect. Reach out to Tina Bhatia at tina@datalogz.io to book a meeting.
🕌 An Exclusive Evening with Datalogz and e6data at Taj Falaknuma Palace, Hyderabad
Hosted by the CEOs of Datalogz and e6data, this invite-only evening brings together leading voices in data and technology at the legendary Taj Falaknuma Palace. Connect over fine dining, signature cocktails, and inspired dialogue in an unforgettable setting. More details on the RSVP link below.
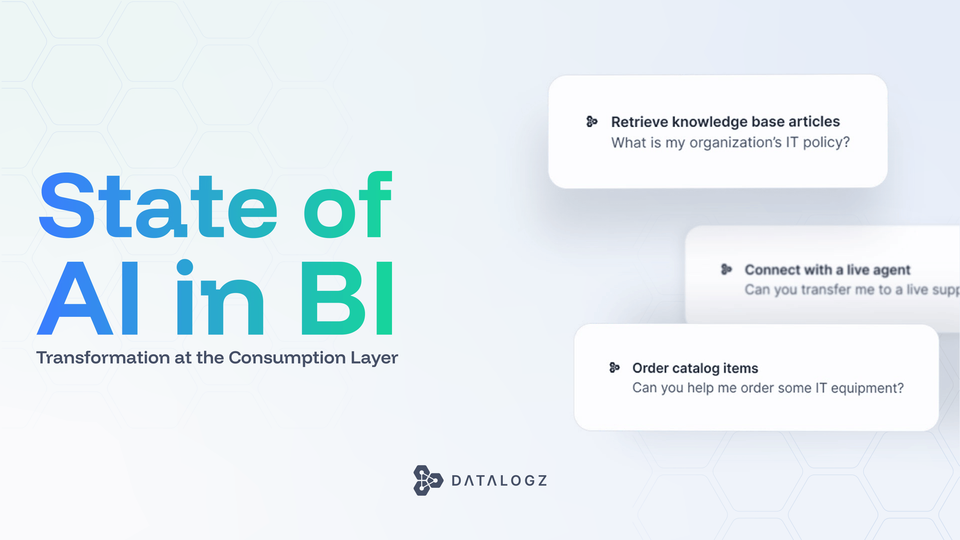
The Next Decade of Analytics | Logan Havern
What does the next ten years of analytics, BI, and data look like? In this video, Logan shares his perspective on the future of decision-making in the enterprise.
He explains why the true cost of analytics is not just the tools but the compute, credits, and engineering hours that power every answer. He highlights the hidden risks of every decision, from questions of accuracy and security to the need for trusted sources. And he makes the case that the future of data belongs to the consumer, not to endless engineering cycles.
At Datalogz, we believe that every data decision carries both cost and risk. Our mission is to monitor, contextualize, and reduce both so that organizations can trust their analytics, scale with confidence, and focus on what matters most: making better decisions.
Frequently Asked Questions
Common questions about this topic, answered.
How can I identify duplicate reports and dashboards across my BI environment?
BI similarity engines can automatically detect and group look-alike reports and datasets across your environment. Datalogz 2.8 introduced a BI Similarity feature that surfaces redundancy at scale and recommends Archive or Consolidate actions, helping organizations reduce maintenance costs and eliminate confusion from duplicate analytics content.
What is BI observability and how does it help with governance?
BI observability provides complete visibility into your organization's dashboards, reports, and data sources through unified asset inventories, real-time health monitoring, and automated alerts. This enables data teams to track freshness, detect schema drift, identify PII exposure, and manage costs across platforms like Tableau, Power BI, and Qlik without configuring custom queries.
What prebuilt monitors should I have for enterprise BI governance?
Enterprise BI governance typically requires monitors for data freshness, schema drift, content duplication, cost spikes, and PII exposure. Datalogz 2.8 offers an expanded Monitor Catalog with prebuilt monitors covering these categories, allowing teams to observe their entire BI estate end-to-end from day one without custom configuration.
How do I get a unified view of all BI assets across my organization?
An Operational Inventory feature consolidates every BI asset into one unified view with real-time asset health status and instant alert pages. Datalogz currently governs more than 720,000 BI assets across enterprise deployments, providing organizations visibility across Tableau, Power BI, Qlik Sense, QlikView, and Spotfire in a single platform.
What's the best way to reduce BI sprawl and cut dashboard maintenance costs?
Reducing BI sprawl requires identifying redundant content and taking consolidation actions. Tools with BI similarity detection can automatically group duplicate reports and recommend archive or consolidate actions. Datalogz has identified over 1.4 million optimization issues across customer BI environments, with cost management alerts alone surfacing over $8.2M in avoidable BI spend.