Data Dive #42: From BI Chaos to AI Confidence: Are You Ready? 🤖
Capabilities to gather, catalog, analyze, and visualize data have grown more powerful, and they are now in the hands of more users.

We’re one-quarter of the way through the 21st century, and already we’ve seen massive transformation in data and analytics.
In 2005, the era of big data arrived. Then, in 2015, the release of Microsoft Power BI ushered in the democratization of business intelligence.
In 2025, product roadmaps and marketing budgets are all signalling that AI will dominate the next decade, if not the rest of the century. Many of our brightest minds believe this revolution will dwarf the impact of any era that came before it.
But, amid all of the hype, it’s important to remember that the future doesn’t erase the past.
Each period of transformation builds on the last, and change is cyclical. Infrastructure, tools, workflows, and best practices aren’t ripped out and replaced. Rather, components are swapped, refined, and calibrated to an organization’s particular needs.
It is in this work that a vision of the future is filled in, until it becomes the living present.
In business intelligence, we’ve taken giant steps on the journey to self-service analytics over the last decade. Capabilities to gather, catalog, analyze, and visualize data have grown more powerful, and they are now in the hands of more users. The consumption layer has become the critical point where users interact with data, and data turns into data products.
NEXT THURSDAY IN NYC: Networking, Expert Panel, and Dinner

Continuing the Future Frontiers event series brought to you by Datalogz, co-sponsored by our friends at Qualytics.
Calling all CDOs, CIOs, CISOs, and data leaders driving innovation in Fortune 1000 enterprises based in NYC!
This event aims to foster a thoughtful discussion on the future of analytics and business intelligence, exploring their impact on the enterprise landscape.
We look forward to an evening of lively conversations and a delicious catered dinner!
BI Similarity is the silent killer in modern analytics environments!
It causes duplicate dashboards, inconsistent metrics, and costly compute waste across Power BI, Tableau, and more. The result? Conflicting insights, eroded trust, and millions lost to BI sprawl.
In this video, discover how Datalogz’s new BI Similarity engine proactively scans your environment, detects and quantifies overlapping reports, and reveals why they’re similar - down to shared data models, logic, and structures. Armed with this visibility, BI leaders can consolidate duplicative assets, certify the right source of truth, and reclaim control over their analytics layer.
A Big Win for the Datalogz Team: Pablo Named to Forbes 30 Under 30
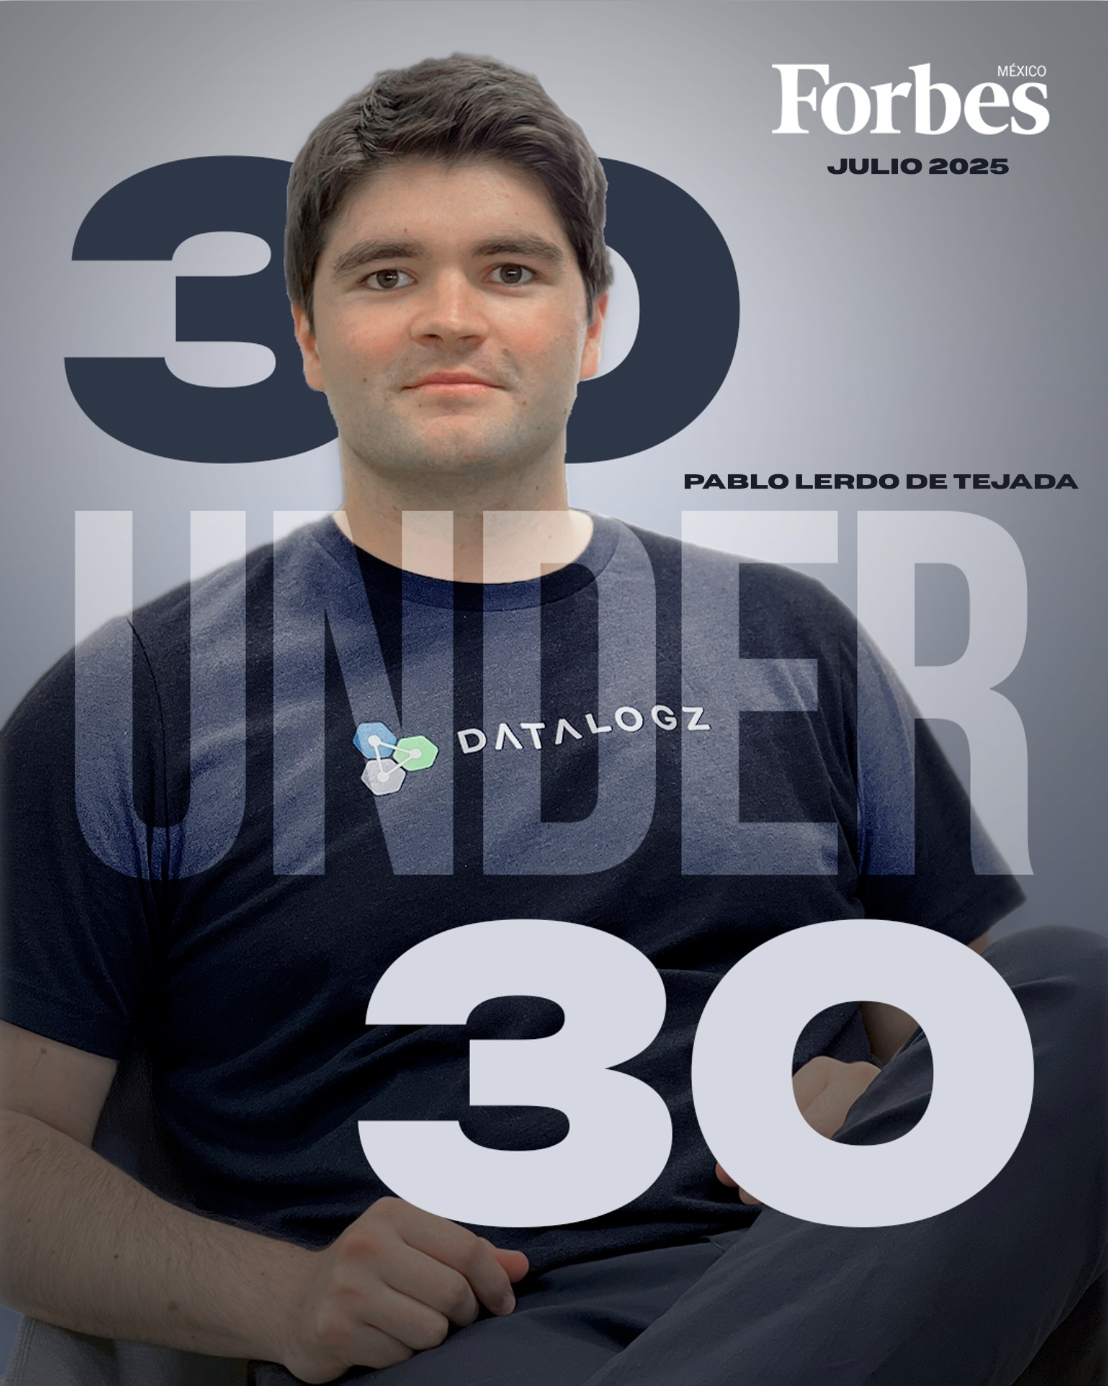
We're thrilled to share that our Co-Founder & COO, Pablo Lerdo de Tejada, has been named to the Forbes 30 Under 30 Latin America 2025 list in the Business & Finance category! This recognition celebrates Pablo’s incredible leadership and vision in building Datalogz into the foremost platform for solving BI sprawl, cutting costs, and bringing real governance to enterprise analytics.
Pablo’s passion for operational excellence and data-driven impact is helping shape the future of BI Ops and we couldn’t be prouder. Onward and upward!
Frequently Asked Questions
Common questions about this topic, answered.
How do I prepare my BI environment for AI initiatives?
AI readiness starts with cleaning up your existing BI foundation. This means addressing BI sprawl, eliminating duplicate dashboards, and ensuring your data assets are properly governed and cataloged. Organizations that skip this step risk feeding AI systems inconsistent or redundant data, undermining confidence in AI-generated insights.
What is BI similarity and why does it matter?
BI similarity refers to duplicate or near-duplicate dashboards and reports that proliferate across analytics environments over time. It's often called a 'silent killer' because it creates confusion about which reports are authoritative, wastes compute resources, and inflates licensing costs. Datalogz identifies similar BI assets across platforms like Tableau, Power BI, and Qlik, helping teams consolidate redundant content before it undermines data trust.
What problems does BI sprawl cause for enterprise data teams?
BI sprawl leads to unmanaged proliferation of dashboards, reports, and data sources that become difficult to govern. This results in conflicting versions of truth, wasted licensing spend on unused assets, and security risks from orphaned content with outdated access controls. Datalogz has identified over 1.4 million optimization issues across customer BI environments, with governance alerts alone accounting for more than 676,000 identified problems.
How has business intelligence evolved over the past two decades?
BI has transformed through three major phases: the big data era starting around 2005, the democratization of analytics with tools like Power BI launching in 2015, and now the AI-driven analytics era emerging in 2025. Each phase builds on the last rather than replacing it—infrastructure, tools, and workflows are refined and calibrated rather than ripped out entirely.
What should data leaders focus on before adopting AI analytics tools?
Before layering AI on top of existing analytics, data leaders should audit their current BI assets for unused content, duplicates, and governance gaps. Organizations managing hundreds or thousands of dashboards often discover significant waste and inconsistency. Datalogz currently governs more than 720,000 BI assets across enterprise deployments, helping teams establish the clean foundation AI systems require.