Data Dive #37: Explosive Growth in Analytics Means BI Sprawl 📈
Most BI teams lack visibility into what’s actually happening across their tools. There’s no central place to monitor usage, identify redundancies, or understand what’s being consumed and what’s going stale.

Business Intelligence (BI) environments are growing faster than ever — more reports, more dashboards, more data products. But with that growth comes a serious challenge: BI Sprawl.
Unmonitored and unmanaged BI environments quickly spiral out of control. Costs skyrocket. Governance breaks down. Security risks increase. And when business users run into issues, getting answers becomes a frustrating, time-consuming process.
The core issue? Most BI teams lack visibility into what’s actually happening across their tools. There’s no central place to monitor usage, identify redundancies, or understand what’s being consumed and what’s going stale.
That’s where the Datalogz Control Tower comes in.
The platform is built to enable data and BI teams to this gap — integrating with tools like Tableau, Power BI, Qlik, and Spotfire to bring clarity and control. Through automated reporting and alerts, they help organizations catch problems early, reduce unnecessary costs, and ensure BI investments are delivering real value.
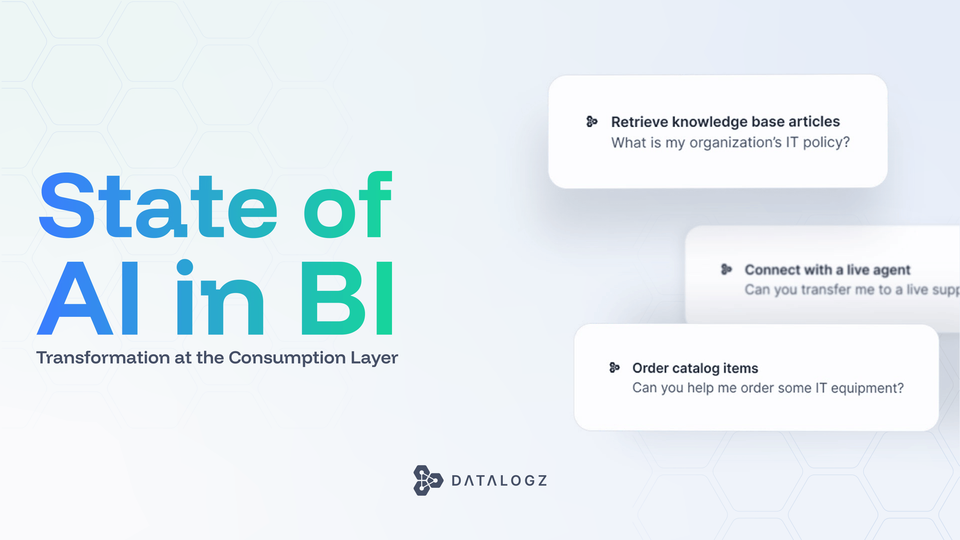
The most impactful approach? Focus on the consumption layer — the point where users engage with data. That’s where inefficiencies show up, and where smart monitoring makes the biggest difference.
Meet us at Tableau Conference 2025
Datalogz is excited to attend the Tableau Conference 2025! Join in our efforts to BI Sprawl, optimize analytics, and empower data-driven teams. Connect with our experts and discover how we’re making BI more efficient and secure. Don’t miss out - see you there! 🚀

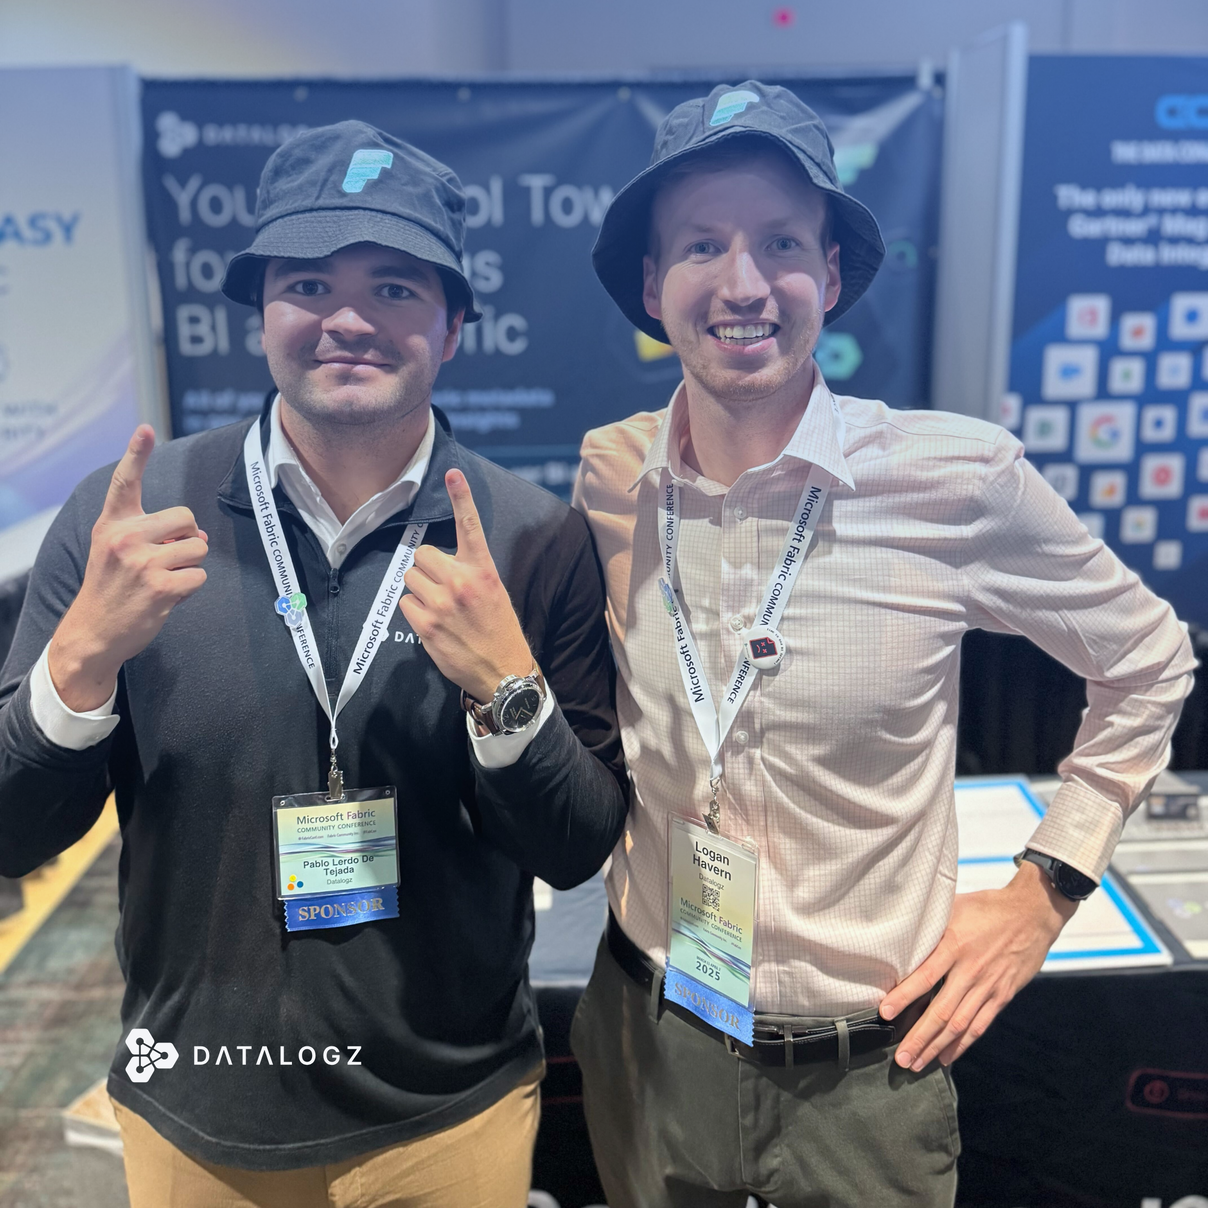
Datalogz at the Microsoft Fabric Community Conference 2025
Microsoft is pushing the boundaries with Fabric, showcasing an ambitious vision for the future of data. However, there's still a clear need for more robust, integrated management tools - especially when it comes to Power BI.
Key themes that dominated conversations included capacity monitoring, data governance, and accelerating migration efforts. That’s where Datalogz Control Tower steps in. More than just a stopgap, Control Tower is uniquely positioned to bridge the current gaps in Fabric and serve as a long-term solution - not just for Power BI, but across your entire BI ecosystem.
It’s no surprise that AI integration across Microsoft’s products is generating major buzz - and with good reason. The potential is massive. But without the right guardrails, this wave of innovation could unintentionally accelerate BI sprawl.
At Datalogz, we believe governance should scale with AI adoption - not stand in its way. That’s why Control Tower is designed to bring visibility, consistency, and control to rapidly evolving BI environments, ensuring AI-powered insights don’t come at the cost of chaos.
We had countless inspiring conversations with customers, partners, and new faces who stopped by our booth throughout the event. FabCon was a powerful reminder of the strength of community and the impact of collaboration.
Frequently Asked Questions
Common questions about this topic, answered.
What is BI sprawl and why is it a problem for enterprise data teams?
BI sprawl refers to the unmonitored proliferation of reports, dashboards, and data products across business intelligence environments. It leads to skyrocketing costs, governance breakdowns, increased security risks, and makes it difficult for business users to find reliable answers. The core issue is that most BI teams lack centralized visibility into usage patterns, redundancies, and stale content across their tools.
How can organizations monitor and control BI sprawl across multiple platforms?
Organizations need a centralized observability platform that integrates with their BI tools to track usage, identify redundancies, and surface stale content. Datalogz Control Tower connects with Tableau, Power BI, Qlik, and Spotfire to provide this visibility through automated reporting and alerts. The platform has identified over 1.4 million optimization issues across customer environments, helping catch problems early and reduce unnecessary costs.
What's the best approach to reducing BI costs and improving governance?
The most impactful approach is focusing on the consumption layer — where users actually engage with data. This is where inefficiencies become visible and where monitoring delivers the biggest ROI. Smart consumption-layer monitoring can surface cost management issues, governance gaps, and security risks before they compound.
Are there tools that work across both Tableau and Power BI for BI observability?
Yes, Datalogz Control Tower supports multi-platform BI environments including Tableau, Power BI, Qlik Sense, QlikView, and Spotfire — which is rare in a single product. The platform currently governs more than 720,000 BI assets across enterprise deployments, making it well-suited for organizations managing diverse BI ecosystems or planning cross-platform migrations.
How do I prepare for a Power BI or Fabric migration from a governance perspective?
Before migrating to Power BI or Microsoft Fabric, organizations should audit their existing BI assets for usage patterns, redundancies, and governance gaps. Key areas to address include capacity monitoring, data governance policies, and prioritizing which assets to migrate. Tools that provide metadata extraction and complexity scoring can help identify which dashboards are worth migrating versus retiring.