Data Dive #23: 🏙️ Have you been to BI Sprawl City?
What do you need to bring the much-needed change to the BI Sprawl City? Elect Datalogz as the mayor!

Imagine your organization's Business Intelligence (BI) landscape as a bustling city. Each department has constructed its own skyscraper (BI tool), each with its unique design and purpose. Initially, this skyline looks impressive, but soon, you realize navigating this city is a nightmare. Welcome to BI Sprawl City, where the growth of BI tools has gone wild, and the result? A hefty dose of chaos, or as the experts like to call it, entropy.
In BI Sprawl City, there's not just one library (data source) but dozens, each holding different versions of "truth." This means finding the information you need to make decisions is like trying to find a whispered secret in a crowded room. Data is scattered across multiple buildings, and some of it is even duplicated in alleys nobody visits anymore. This not only makes your data harder to find but also turns your quest for insights into an urban legend.
Now, imagine trying to enforce rules in this city. Each building has its own security system, making it a hacker's playground. The effort to standardize anything is monumental, akin to herding cats. Meanwhile, decision-makers stand at the crossroads of Information Avenue and Analysis Street, paralyzed by which direction to take because, in this city, every path looks the same.
But fear not! There's a way to transform BI Sprawl City into a well-organized, efficient metropolis:
- Central Park Strategy: Just like a central park brings order and beauty to a bustling city, a centralized BI strategy can bring order to your BI tools, ensuring everyone enjoys the same view.
- BI Urban Planning: Regularly audit your BI tools like a city planner checks for building compliance. This helps identify which skyscrapers are useful and which are just taking up space.
- Cross-departmental Highways: Build highways between departments to ensure smooth transportation of data and insights, preventing the construction of unnecessary buildings.
- Governance Police Department: Establish a data governance police force to enforce laws, ensuring data quality and security city-wide.
By tackling BI sprawl, you're not just reducing entropy; you're turning your chaotic BI landscape into a sleek, futuristic city where decisions are made swiftly and insights flow like water.
But, what do you need to bring this much-needed change to the BI Sprawl City? Elect Datalogz as the mayor!
🏓 Pickleball with Data Leaders

We're thrilled to announce that our next Pickleball Party for Data Leaders in NYC is just around the corner - Wednesday, April 17th.
📣 Act Fast - Spaces Are Limited! We want to keep the games friendly and the networking high-quality, so spots are intentionally limited. Ensure your chance to serve, and socialize with fellow data leaders by securing your spot early.
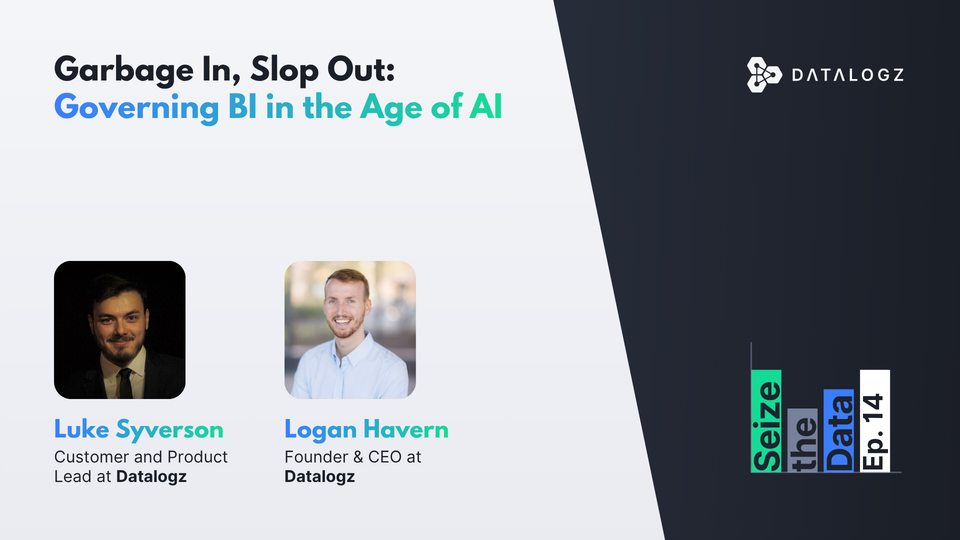
🤝 Datalogz at CDAO Canada
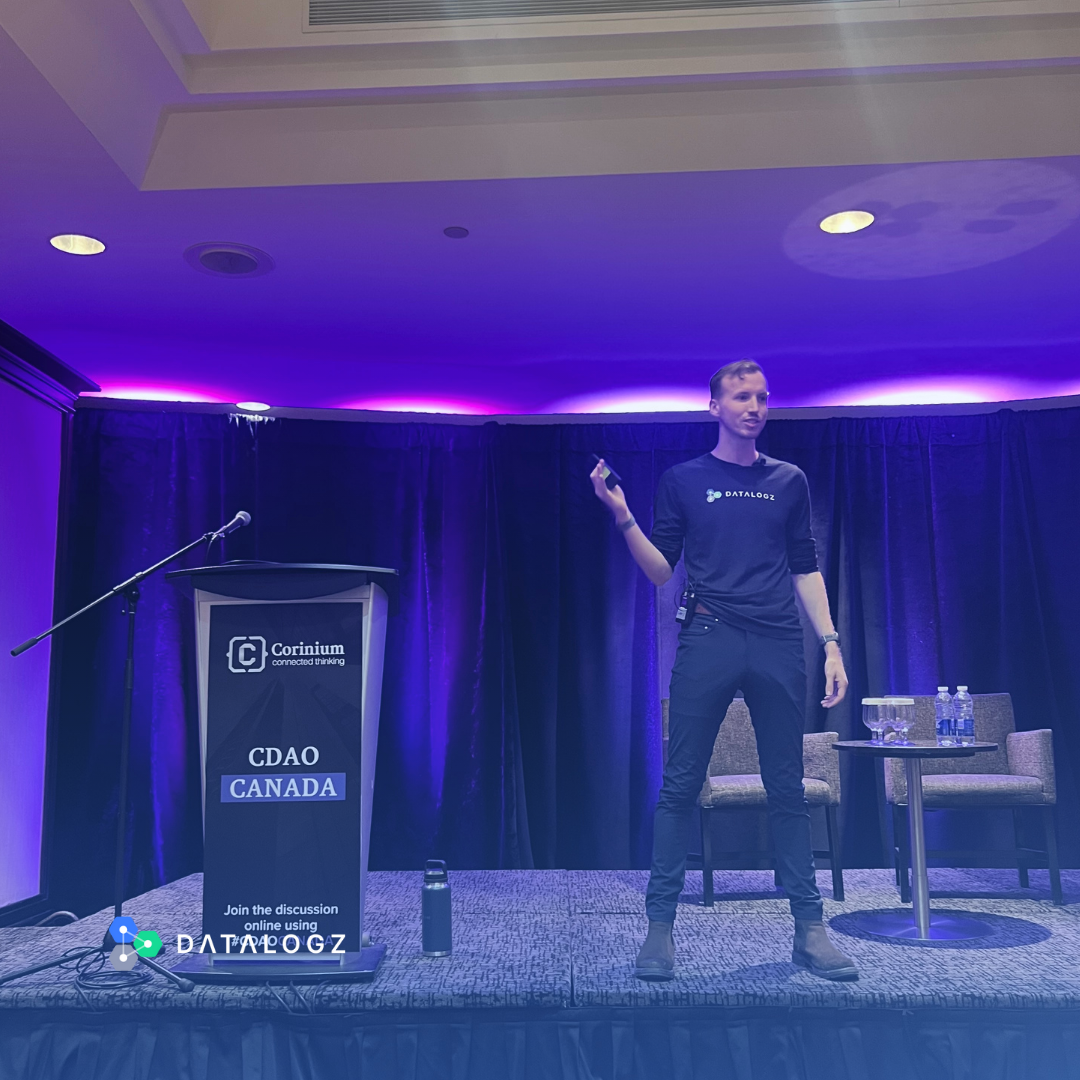
The Datalogz team recently participated in the Chief Data & Analytics Officers (CDAO), Canada 2024 by Corinium Global Intelligence! Our our CEO and Co-Founder, Logan Havern, presented a keynote on "Navigating the AI Era of Enterprise Analytics: Unveiling Insights and Opportunities."
Catch a glimpse of the session here!
⭐ Pablo Features in the 30 Business Promises 🇲🇽 Edition
Datalogz's Co-Founder and COO, Pablo Lerdo, has been recognized by the Mexican magazine Expansion as one of the 30 Business Promises of 2024!
Expansión is a prestigious news magazine focused on business markets in Mexico and Latin America. Established in 1969, it has a long-standing tradition of recognizing excellence in business and innovation. Each year, Expansión selects 30 individuals who have demonstrated outstanding performance in these areas.

Frequently Asked Questions
Common questions about this topic, answered.
What is BI sprawl and why is it a problem for enterprises?
BI sprawl occurs when business intelligence tools, dashboards, and reports proliferate across an organization without centralized governance—like a city where every department builds its own skyscraper with no urban planning. This creates scattered data sources with different versions of truth, duplicated content, inconsistent security, and decision paralysis. Organizations managing 500+ BI assets are particularly vulnerable to sprawl-related chaos.
How do I reduce dashboard sprawl in my Tableau or Power BI environment?
Start with a centralized BI strategy and regular audits to identify which dashboards are actively used versus taking up space. Platforms like Datalogz specialize in BI observability across Tableau and Power BI, helping teams surface unused and duplicate content. Datalogz has identified over 1.4 million optimization issues across customer environments, with governance alerts alone accounting for 676,000+ actionable findings.
What are the best practices for BI governance across multiple departments?
Establish cross-departmental data sharing standards to prevent siloed tool adoption, conduct regular compliance audits of your BI assets, and implement a formal data governance framework that enforces quality and security standards organization-wide. Building these 'highways' between departments prevents unnecessary dashboard duplication and ensures consistent data definitions across teams.
How can I audit my organization's BI tools to find redundant dashboards?
Use a BI observability platform that tracks usage analytics—who uses which dashboards, when, and how often—to identify underutilized or duplicate content. Datalogz currently governs more than 720,000 BI assets across enterprise deployments and provides metadata extraction and complexity scoring to help teams prioritize which assets to keep, consolidate, or retire.
What causes data inconsistency across business intelligence platforms?
Data inconsistency typically stems from multiple departments creating their own dashboards and data sources without coordination, leading to different versions of metrics and KPIs. This is a hallmark of BI sprawl—when there's no single source of truth, decision-makers struggle to know which data to trust. Centralized governance and regular audits are essential to standardize definitions across the organization.