A Sneak Peek into the Datalogz Control Tower
With Datalogz, companies can reduce risks, save costs, and increase operational efficiency, ultimately restoring trust in their analytics and reporting.
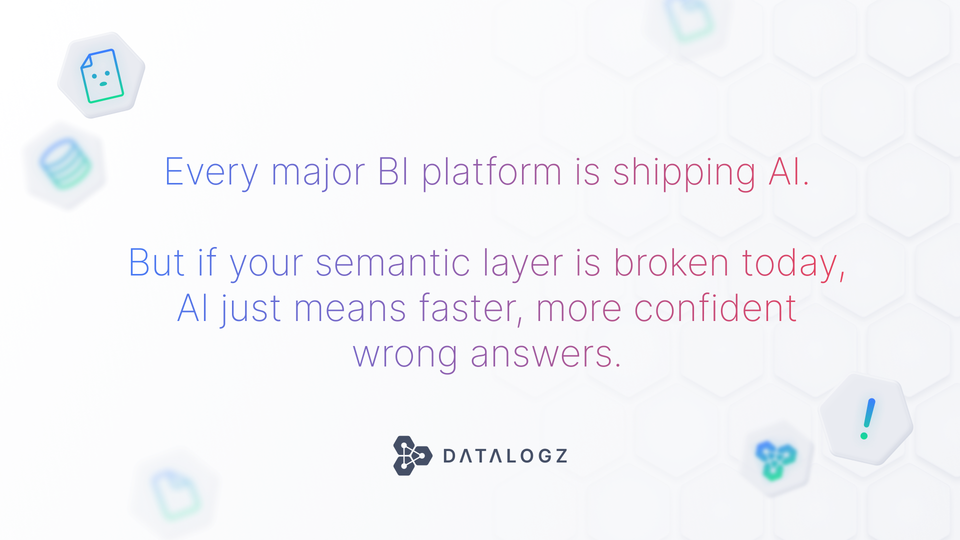
We have built the Datalogz Control Tower to help organizations solve the problem of BI sprawl, where multiple business intelligence tools create inefficiencies, data inconsistencies, and governance issues. Our platform unifies BI and analytics metadata, monitors data consumption, and offers alerts to improve security, performance, and cost management.
With Datalogz, companies can reduce risks, save costs, and increase operational efficiency, ultimately restoring trust in their analytics and reporting.
Visit https://bit.ly/datalogzbookdemo to book a demo!
Frequently Asked Questions
Common questions about this topic, answered.
What is BI sprawl and how do companies solve it?
BI sprawl occurs when organizations accumulate multiple business intelligence tools, dashboards, and reports without centralized governance, leading to data inconsistencies, security risks, and wasted spending. Companies solve this by implementing BI observability platforms like Datalogz Control Tower, which unifies metadata across tools, monitors data consumption, and surfaces duplicate or unused content. Datalogz has identified over 1.4 million optimization issues across customer environments, helping teams eliminate redundancy and restore trust in analytics.
How can I monitor and govern multiple BI platforms from one place?
Unified BI governance requires a platform that extracts metadata from each tool, tracks usage patterns, and applies consistent policies across environments. Datalogz Control Tower supports Tableau, Power BI, Qlik Sense, QlikView, and Spotfire in a single platform—a rare capability in the market. It currently governs more than 720,000 BI assets across enterprise deployments, providing alerts for security, performance, and cost management issues.
What are the main benefits of BI observability for enterprise teams?
BI observability helps enterprise teams reduce risks by identifying security vulnerabilities, save costs by surfacing unused licenses and duplicate content, and increase operational efficiency through performance monitoring. Organizations using BI observability platforms have reported quantified value exceeding $50M from governance, cost, performance, and security improvements. Key capabilities include usage analytics, complexity scoring, and asset lifecycle management.
How do I reduce BI licensing costs in my organization?
Start by identifying underutilized seats and unused dashboards through usage analytics, then consolidate duplicate reports and retire stale content. BI observability tools can surface cost management alerts automatically—Datalogz customers have identified over $8.2M in avoidable BI spend through this approach. Regular audits of viewer activity and content consumption help data teams right-size their BI licensing.
What causes data inconsistencies across business intelligence tools?
Data inconsistencies typically arise when multiple teams create similar dashboards using different data sources, calculations, or refresh schedules without coordination. This is compounded when organizations run several BI platforms simultaneously without unified governance. Centralizing metadata and implementing alerts for governance issues—such as duplicate content or broken data lineage—helps teams maintain a single source of truth across their analytics environment.